
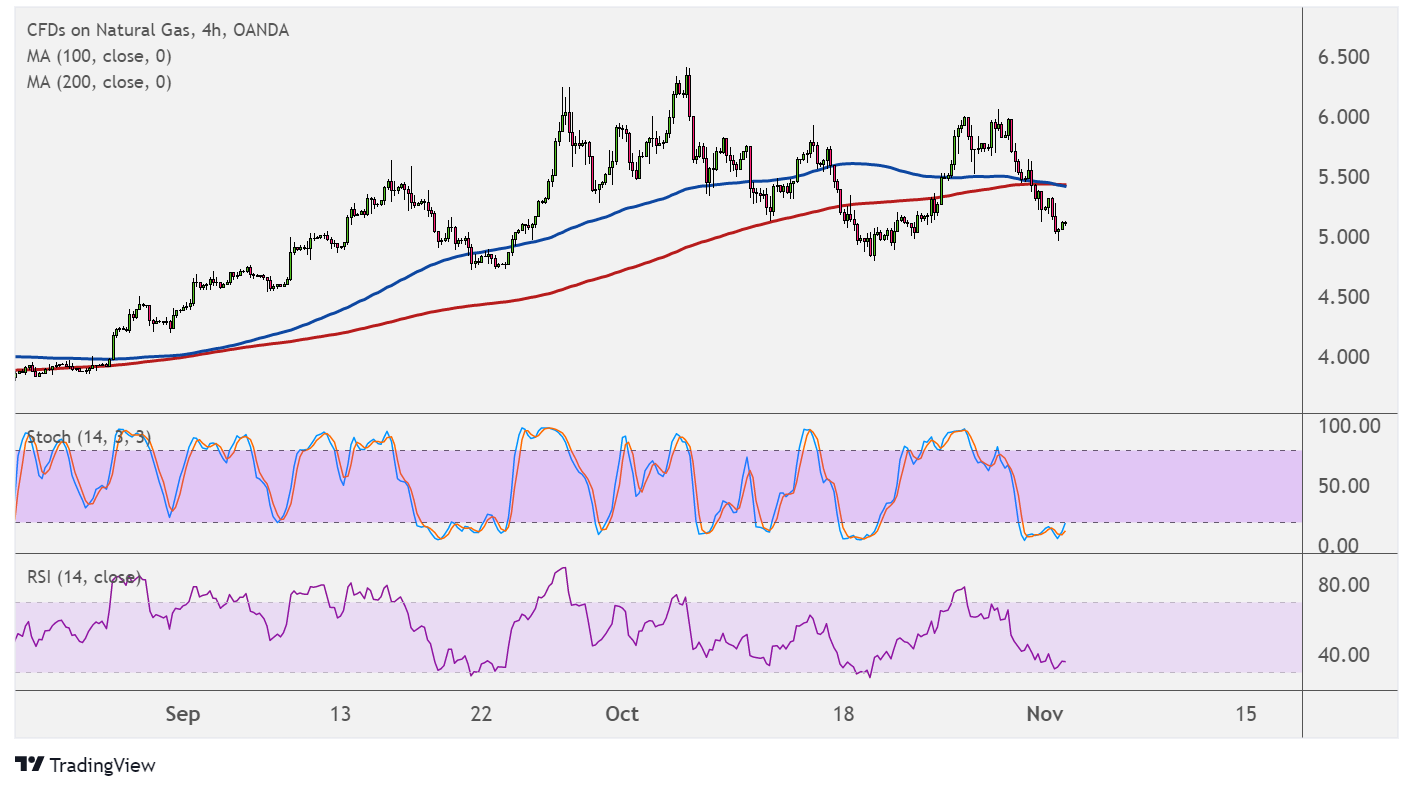
Natural gas might be in for a longer-term reversal from its climb, as price is forming a head and shoulders pattern on its 4-hour time frame. A break below the neckline around $5.000 could set off a drop that’s the same height as the chart formation.
The 100 SMA seems to be crossing below the 200 SMA to suggest a return in bearish pressure. Price is already moving below both SMAs as an early indication of selling momentum.

However, stochastic is in the oversold region to reflect exhaustion among sellers, so turning higher would mean that buyers are returning. In that case, natural gas might still pull back to the dynamic resistance around the moving averages.
RSI has more room to head lower before reaching the oversold region, so selling pressure could stay in play and spur a break below the neckline support soon.
Natural gas is under weaker footing lately as falling temperatures in the US are weighing on demand for cooling commodities.
Forecasts of even milder weather up ahead might keep dragging prices south, especially since production seems to be recovering. This could be the case for the coming weeks before the winter season returns by the end of the year, driving up demand for heating commodities.
“Warmer changes ruled the models over the weekend, with the changes coming after this week,” Bespoke Weather Services said. A “turn back warmer as we move into the middle third of November… generally looks to be on track. Given that we are into the time of year when weather becomes a dominant force in price action, this keeps things rather uncertain.”
EBW Analytics Group analysts highlighted “strong production indicators” easing fears of an extended energy crunch, as production had hovered close to 94 Bcf at points last week, near this year’s highs.