
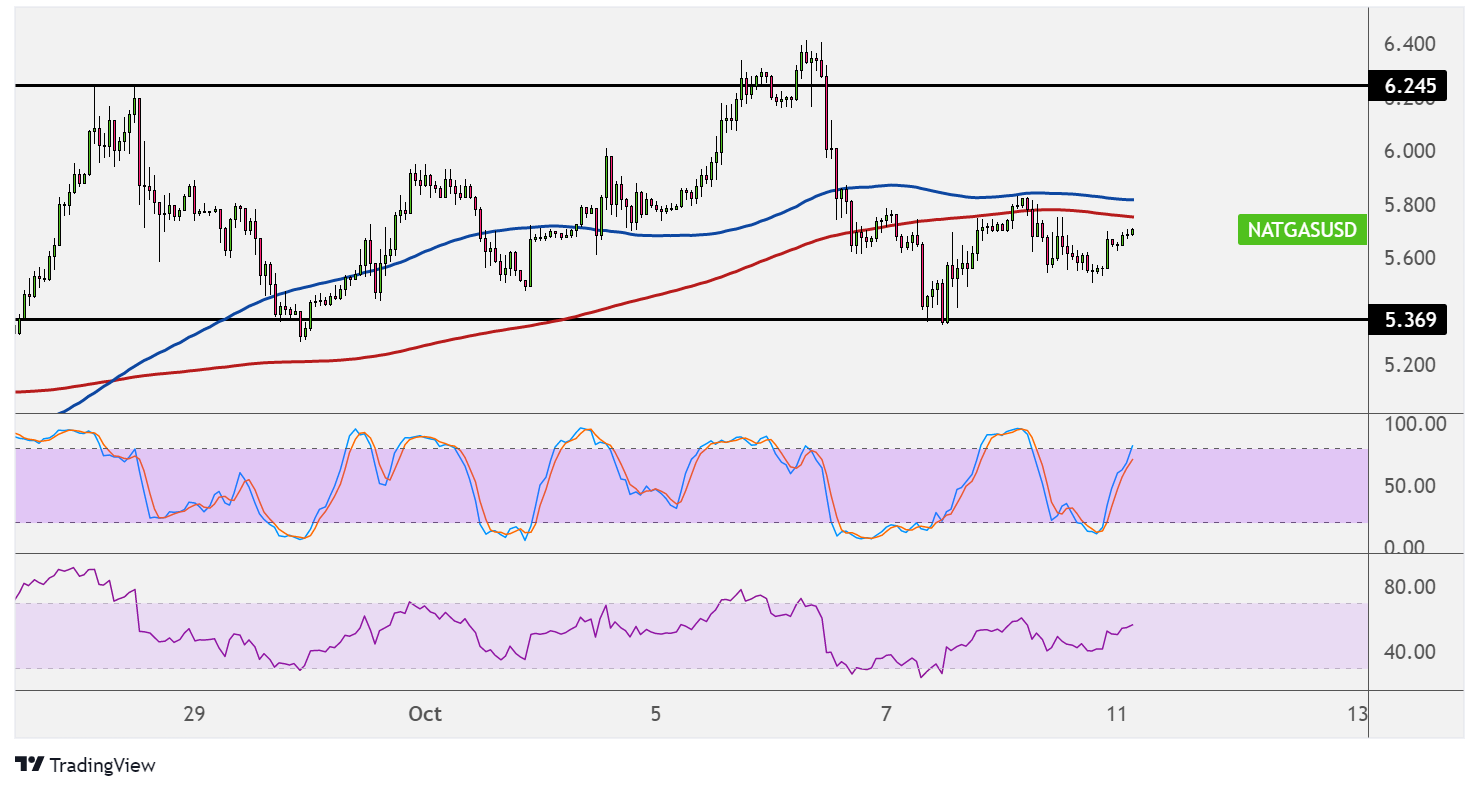
Natural gas is moving sideways on its short-term chart, as price found resistance at $6.245 and bounced off support at $5.370. Price is closing in on the middle of its range near the moving averages.
The 100 SMA is still above the 200 SMA to indicate that the path of least resistance is to the upside or that resistance is more likely to break than to hold. Price is moving below both indicators, but a break above these dynamic inflection points could clear the path for a move back to the top.

Note, however, that the gap between the moving averages is narrowing to reflect weakening bullish momentum and a potential bearish crossover.
Stochastic has a bit of room to climb before reflecting overbought conditions, so buyers could stay in control for a bit longer. RSI is also on the move up but approaching the overbought level. Turning lower could mean that sellers are back in the game.
Natural gas demand in Europe and Asia remains at record highs while supply has undergone some constraints. In the near-term, demand for cooling commodities would likely be subdued in the US since temperatures are dropping.
However, weather disturbances could continue to disrupt production activity and therefore keep a lid on output all the way until the start of the winter season. This could pave the way for more expensive heating commodities, so businesses might opt to stockpile much earlier.
The upcoming release of the inventory report from the Department of Energy should shed more light on supply and demand conditions. The previous report reflected a larger than expected build since purchases have slowed recently, but another small increase or a surprise draw might continue to lift natural gas prices.
On the other hand, another larger than expected increase in stockpiles might suggest that demand continues to tumble and could carry on in the coming months.