
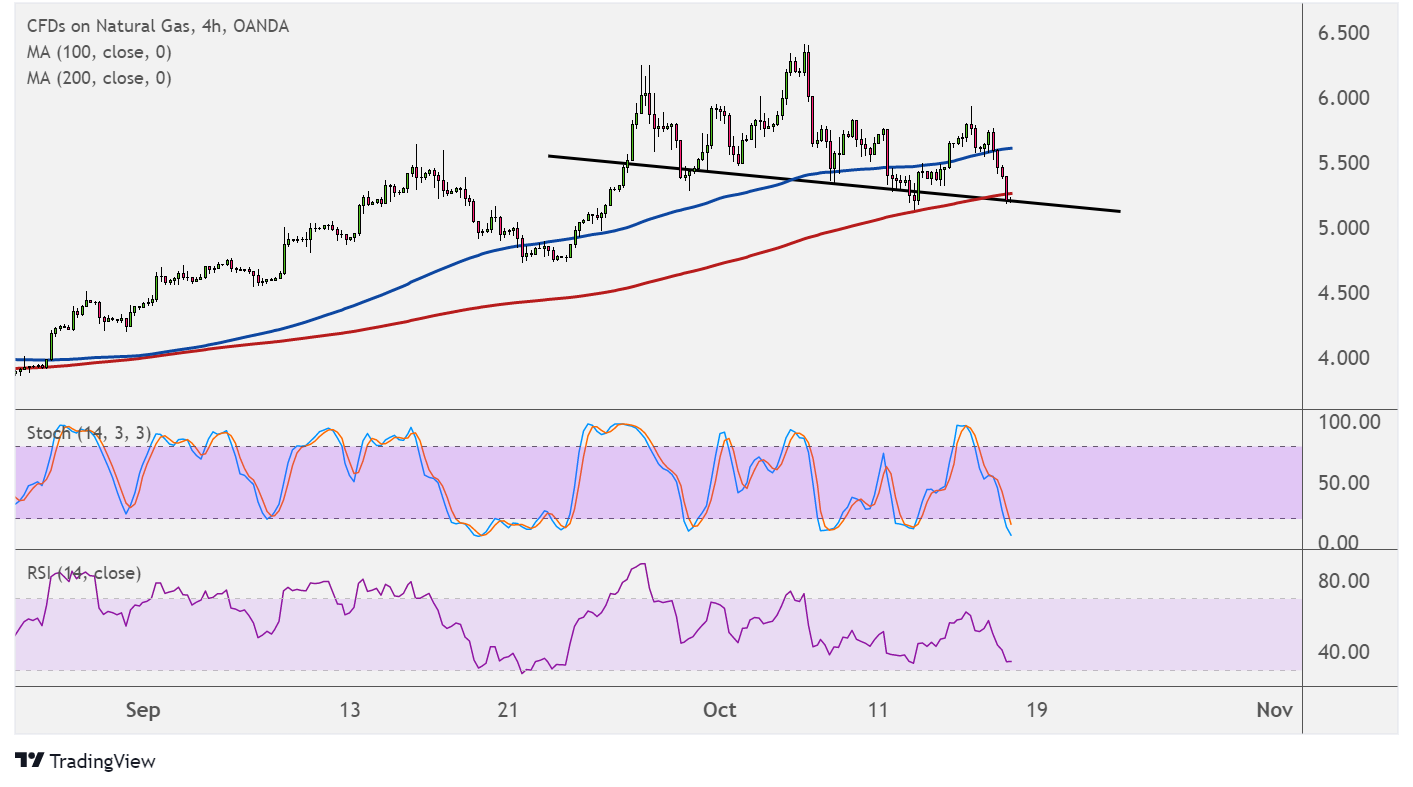
Natural gas might be in for a reversal on its rally, as price is forming a complex head and shoulders on its 4-hour chart. A break below the neckline at $5.000 could set off a drop that’s the same height as the chart pattern.
This head and shoulders formation spans around $5.000 to $6.450, so the resulting slide could take natural gas $1.450 lower. However, technical indicators are suggesting that the uptrend might still resume.

The 100 SMA is above the 200 SMA to indicate that support is more likely to hold than to break. Price has broken below the 100 SMA dynamic inflection point as an early indication of selling pressure, but it remains above the 200 SMA dynamic support that coincides with the neckline.
Stochastic is heading down but already dipping into the oversold region to signal exhaustion among sellers. Turning back up would mean that buyers are taking over and could allow natural gas to bounce back to its recent highs.
RSI is also moving down but approaching oversold territory to suggest that bearish pressure might fade soon.
Natural gas is under downside pressure due to dropping temperatures that are weighing on demand for cooling commodities. This seasonal price movement is typical around this time of the year, before purchases pick up again when winter approaches.
Still, analysts predict that prices could stay elevated leading up to winter months since there is an energy crunch going on. Europe and China are seeing lower production levels and potentially increased demand since colder weather appears to be setting in already.
The upcoming inventory report from the Department of Energy would have more insights on supply and demand conditions over the past week. A draw in stockpiles or a small build might be enough to keep the commodity supported while a large build could lead to a drop in natural gas prices.