
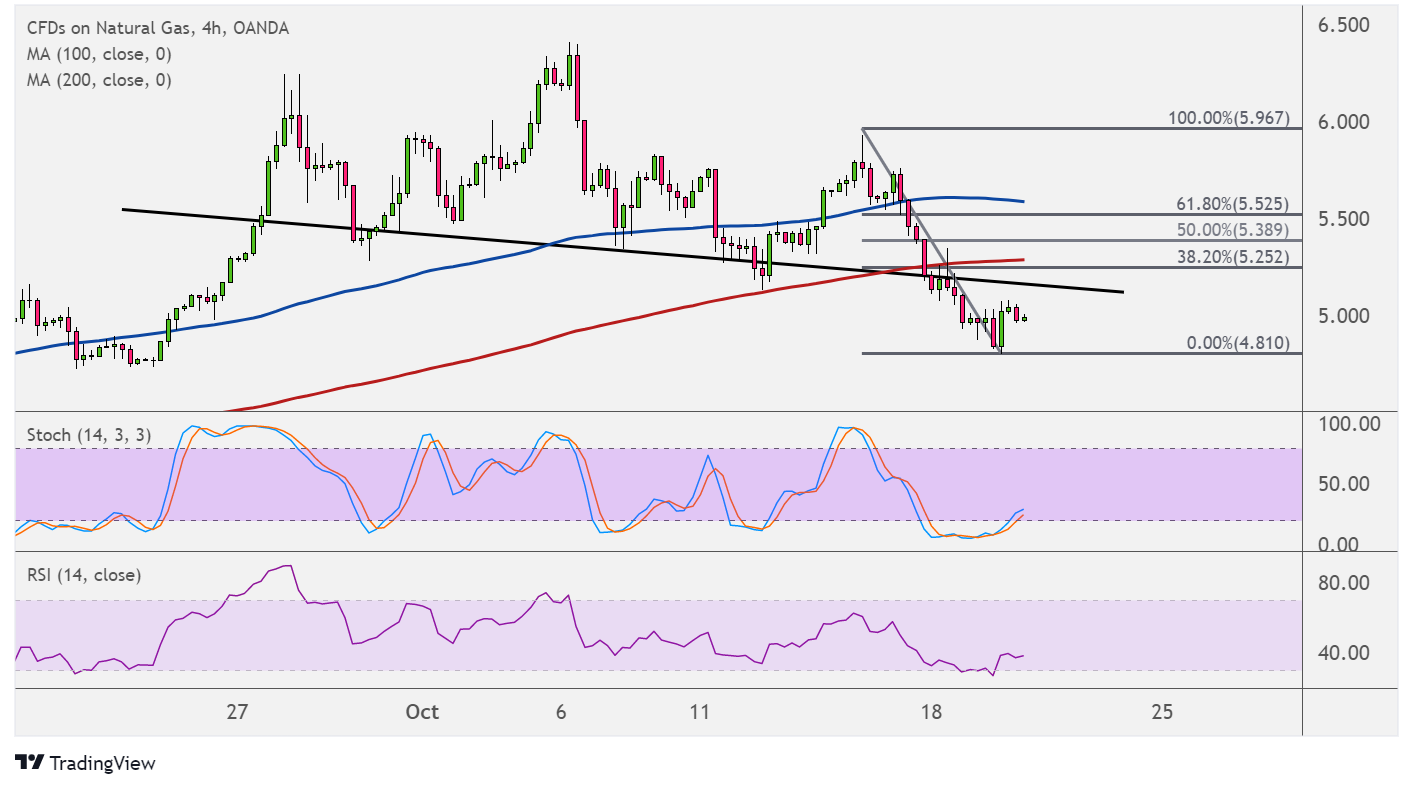
Natural gas broke below the neckline of its head and shoulders to confirm that a reversal from the uptrend is in order. Price might still retest the broken support before heading further south.
Note that the chart pattern spans around $5.200 to $6.450, so the resulting slide could be of the same height. This could take natural gas down to the $4.000 area of interest once more.

Applying the Fibonacci retracement tool shows that the 38.2% level is close to the neckline around $5.250 and might be enough to keep gains in check. A larger pullback could reach the 50% level at $5.389 or the 61.8% Fib at $5.525.
The 100 SMA is still above the 200 SMA to suggest that the path of least resistance is to the upside or that there’s a chance the uptrend could carry on. However, natural gas already broke below both dynamic inflection points so these could hold as resistance on corrections.
Stochastic just reached the oversold region to signal exhaustion among sellers, and the oscillator is pulling higher to reflect a return in bullish pressure. RSI is also heading up, so natural gas price might follow suit as buyers regain the upper hand.
Natural gas is under downside pressure since demand in the US is likely to slow in the coming months. Dropping temperatures could weigh on purchases of cooling commodities, at least until the winter season draws near.
The upcoming inventory report from the Department of Energy should shed more light on supply and demand conditions. Note that output has also been limited on account of weather disturbances, so a small build might be reported.
Analysts are projecting a build of 94 Bcf versus the earlier 81 Bcf gain, reflecting a slowdown in purchases for the past week. A larger build might signal that demand has taken a huge hit, likely weighing on prices even further.