
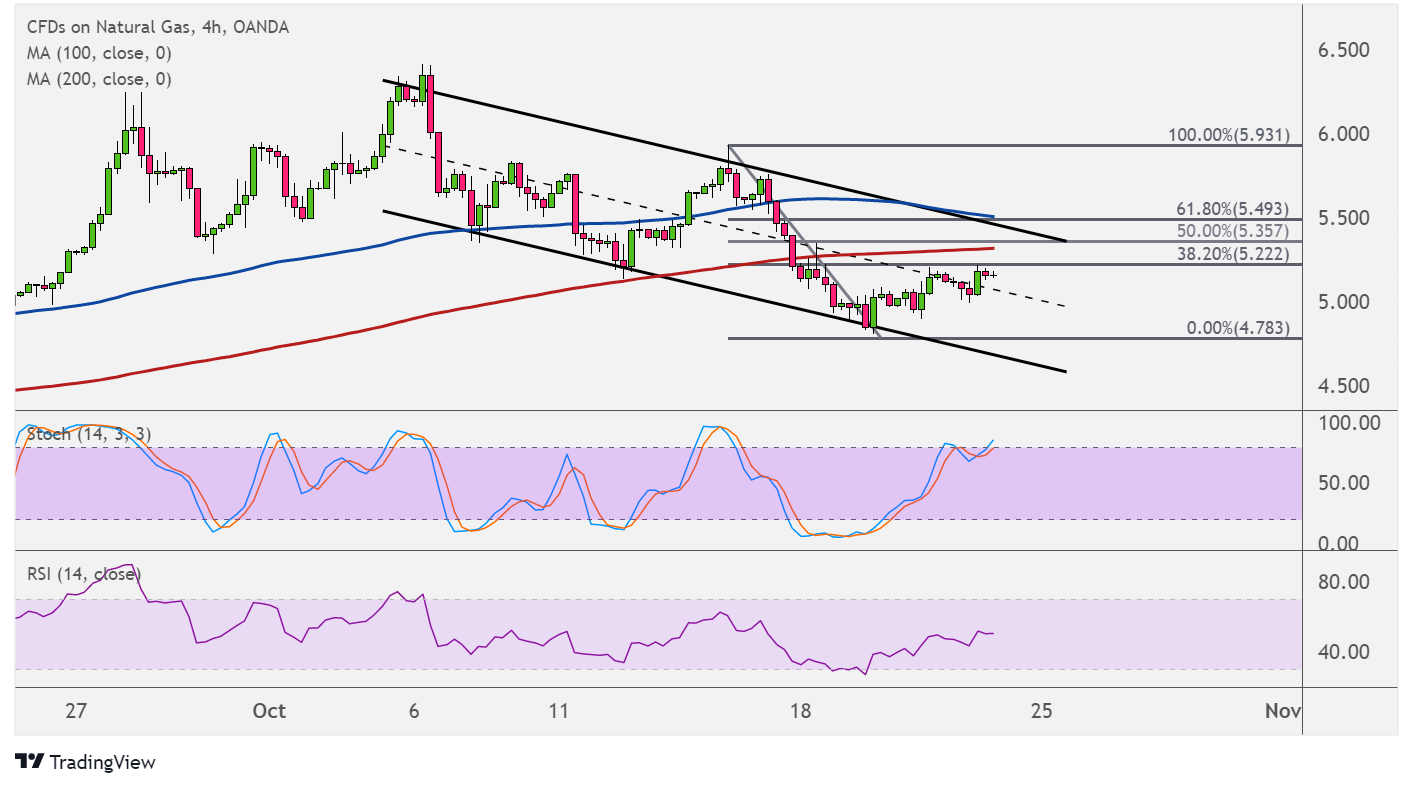
Natural gas is still in correction mode, with price hovering close to the 38.2% Fibonacci retracement level around the mid-channel area of interest.
If the correction keeps going, price could reach the 50% level that’s closer to an area of interest or former support at $5.357. A larger pullback could test the 61.8% Fib that lines up with the channel top, $5.500 major psychological mark, and 100 SMA dynamic inflection point.

On the subject of moving averages, the 100 SMA is still above the 200 SMA to suggest that there’s a chance resistance levels might be broken. If that happens, natural gas could be in for a reversal from its short-term decline.
However, the gap between the indicators is narrowing to reflect weakening bullish momentum and a potential bearish crossover. If any of the Fibs hold as resistance, natural gas could fall back to the lows at $4.783 or the channel bottom closer to $4.500.
Stochastic is still on the move up, so there is some bullish pressure present. However, the oscillator is also approaching the overbought zone to signal exhaustion among buyers. Turning lower would confirm that selling pressure is returning.
RSI has more room to climb, suggesting that the correction could keep going for much longer until overbought conditions are met.
Natural gas remains supported in the long-run, as rising demand and crippled supply could pave the way for an expensive winter season in terms of heating supplies. This could drive up stockpiling activity if buyers are eager to purchase ahead of time while prices remain relatively low.
In the short-term, though, demand would likely keep sliding as dropping temperatures in the US weigh on purchases of cooling commodities. The Department of Energy reported a larger than expected build of 92 Bcf in stockpiles versus the estimated 87 Bcf increase and the earlier 81 Bcf rise.