
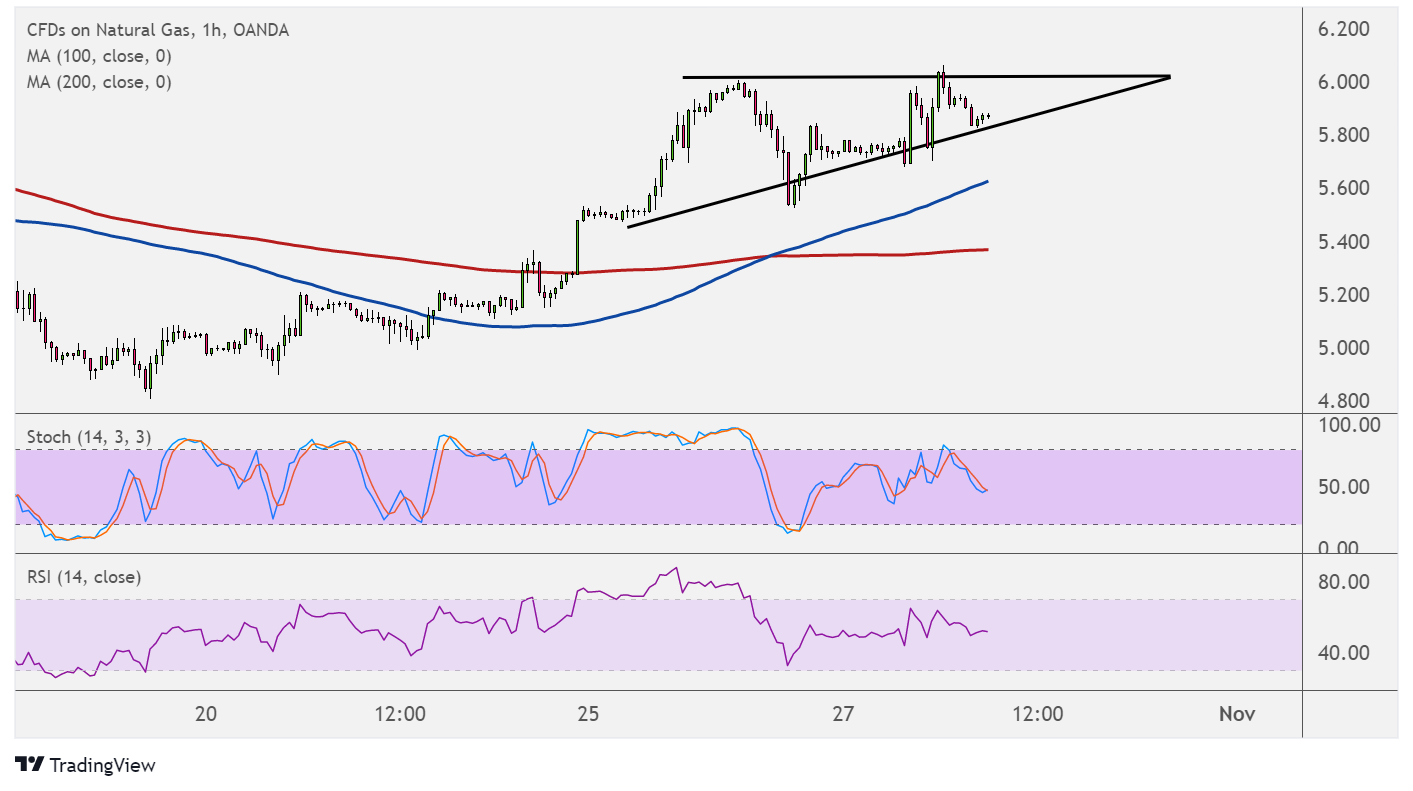
Natural gas formed a short-term ascending triangle consolidation pattern on its hourly chart, and another breakout might follow soon.
Technical indicators are suggesting that a bullish move is likely, with the 100 SMA above the 200 SMA to confirm that the path of least resistance is to the upside. A move past the $6.000 level could set off a climb that’s at least the same height as the triangle pattern.

Natural gas is also trading above both moving averages, so these could hold as dynamic support on dips. Stochastic is heading south after all, so bearish pressure might still be in play. The oscillator has plenty of room to move lower before indicating oversold conditions or exhaustion among sellers.
RSI is on middle ground to reflect consolidation, barely offering strong directional clues at the moment.
The Department of Energy is scheduled to print its latest natural gas inventory levels today, and a smaller build of 86 Bcf is eyed to follow the earlier increase of 92 Bcf. This would signal that demand is picking up, possibly on stockpiling activity as businesses and consumers might be keen on making purchases in advance.
A smaller than expected build might even be more bullish for the commodity while a larger increase could keep gains in check.
Note that analysts are predicting a 10% increase in demand for natural gas in China as the winter season approaches. Supply has been limited on account of weather disruptions like flooding weighing on production activity.
In the US, the Census Bureau predicts that households that primarily use natural gas for space heating will spend an average of $746 on heating this winter season, which is $172 or 30% higher than last year. Forecasts of a colder winter might also drive up demand and prices even higher.