
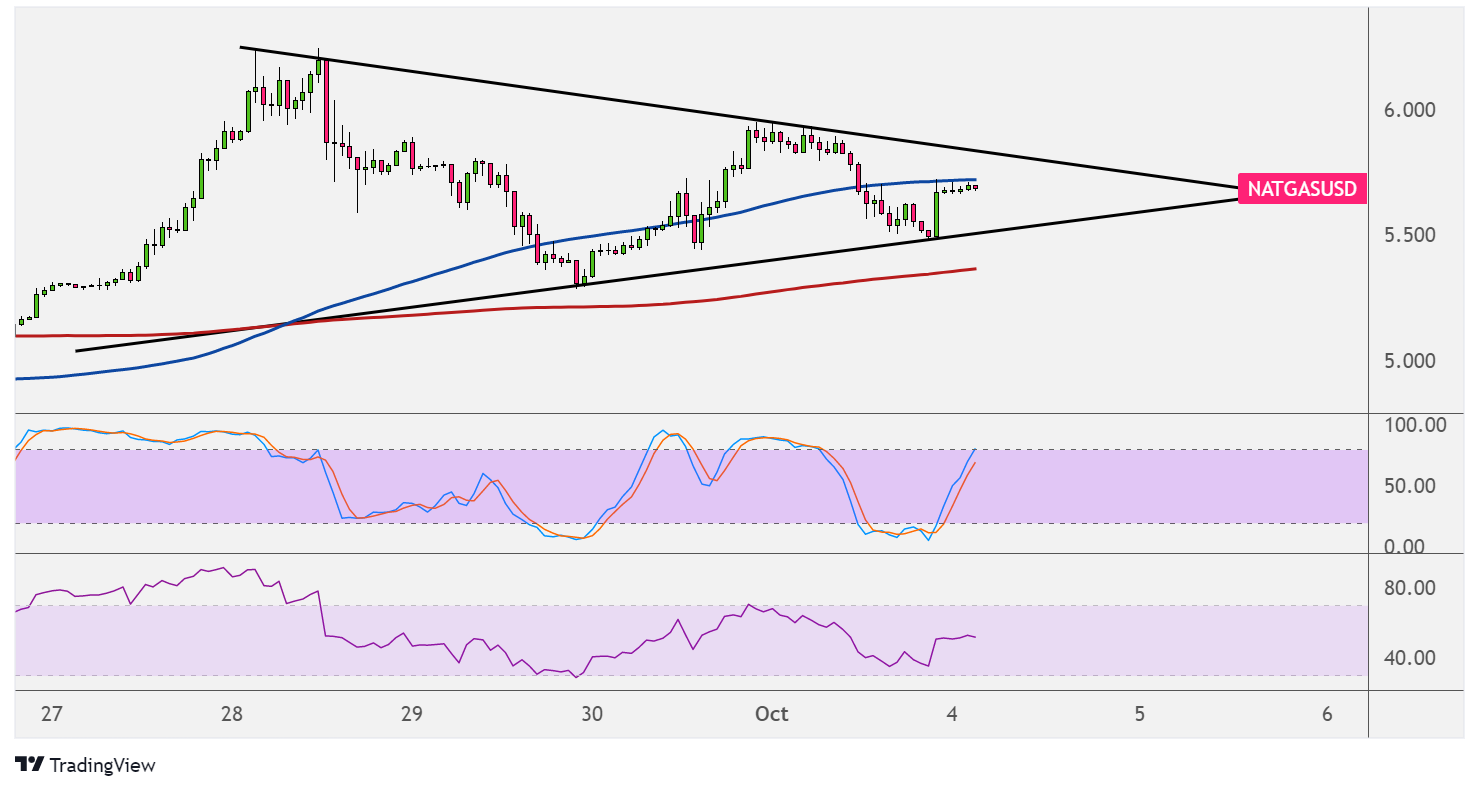
Natural gas has formed lower highs and higher lows to consolidate inside a newly-forming symmetrical triangle on its hourly chart. Price just bounced off the bottom and could be due for a test of resistance.
The 100 SMA is above the 200 SMA to confirm that gains are in the cards, but natural gas is trading below the faster-moving MA to suggest that bearish pressure is picking up. Still, the gap between the indicators is widening to confirm bullish momentum.

Stochastic is also on the move up, so price could follow suit as buyers are in control. The oscillator is closing in on the overbought zone, though, so selling pressure might return soon. RSI has more room to climb before indicating exhaustion among buyers, so there could be a chance for a bullish break.
If that happens, natural gas could climb by the same height as the triangle chart pattern. Similarly a break below support could set off a drop that’s the same size, although the 200 SMA might still hold as dynamic support.
Natural gas has drawn support from expectations of another supply crunch due to weather disturbances. Recall that the previous hurricane left majority of production offline, leading to weaker output for days.
However, demand is also turning lower as temperatures are starting to drop. This weighs on purchases of cooling commodities and could continue to do so for the coming months.
Even so, expectations of an expensive winter season in terms of heating commodities could drive up stockpiling activity among businesses. In turn, this could prop up demand much earlier on and allow the longer-term climb of natural gas to resume.
The upcoming inventory report should have more insights on supply and demand conditions, with a surprise draw in stockpiles possibly leading to a bullish triangle breakout.