
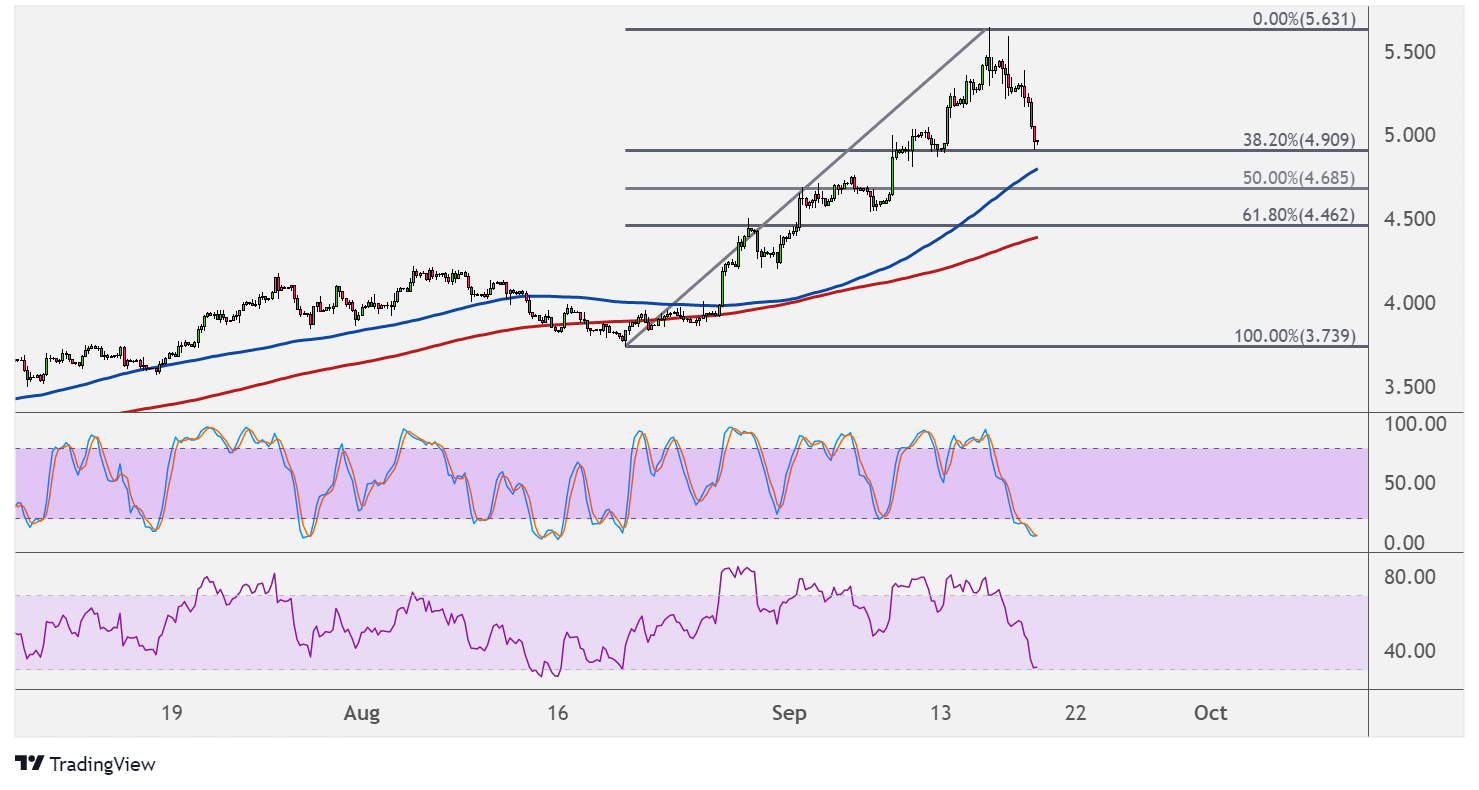
Natural gas is pulling up from a strong rally in the previous week, as resistance around $5.600 is holding. Price is closing in on the support areas marked by the Fibonacci retracement tool.
The 38.2% level is close by at $4.909 then the 50% level is at $4.685. A larger correction could reach the 61.8% Fib at $4.462, which lines up with the 200 SMA dynamic inflection point.

On the subject of moving averages, the 100 SMA is above the 200 SMA to confirm that the path of least resistance is to the upside or that support levels are more likely to hold than to break. In that case, natural gas could soon resume the climb to the swing high or higher.
Stochastic is heading lower but already dipping into the oversold region to signal exhaustion among sellers. Turning back up would mean that buyers are returning and ready to let the uptrend resume.
RSI is also heading south, and the oscillator has a bit more room to move down before reaching the oversold area. This means that the correction could keep going for a bit longer before buyers take over.
Natural gas prices are on track to bring one of the most expensive winter seasons on record in terms of heating commodities. Supply constraints brought about weather disturbances and resulting shut-ins over the past week brought bullish momentum on the commodity.
The upcoming inventory report from the Department of Energy might show a draw in stockpiles, reflecting the production limitations in the past week. Still, falling temperatures likely kept a lid on demand for cooling commodities, so the reduction in inventories might not be so pronounced.
Risk appetite stemming from central bank announcements, particularly the FOMC, would likely push commodities around as well. If the Fed confirms that they’re set to start tapering in November, riskier assets like natural gas could give up gains.