
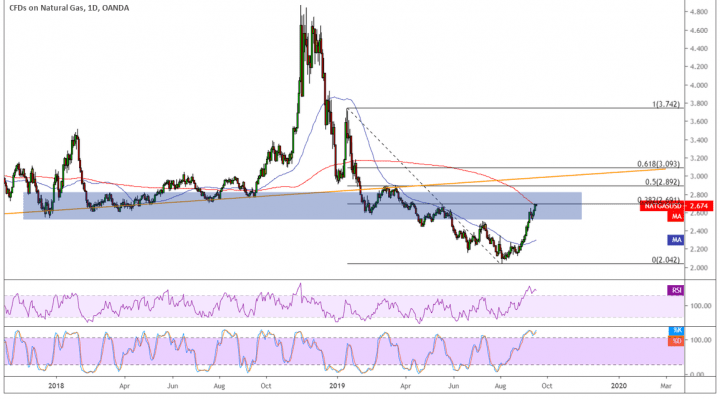
Natural gas is still in correction mode and is testing the area of interest that lines up with the 38.2% Fibonacci retracement level. If this keeps holding, price could resume the slide to the swing low at $2.042.
A larger pullback could last until the broken shallow rising trend line visible on longer-term charts. This is closer to the 50% Fib around $2.900 or possibly even the $3.000 major psychological resistance. The 61.8% Fib at $3.093 could be the line in the sand for a correction.

The 100 SMA is below the longer-term 200 SMA for now to indicate that the path of least resistance is to the downside. In other words, resistance levels are more likely to hold than to break. Then again, the faster-moving MA seems to be bottoming out and closing the gap with the slower MA to reflect weakening bearish pressure.
RSI is already in the overbought zone to signal that buyers are tired and that sellers are ready to take over. Similarly stochastic is in the overbought region and might be due to head south soon, so price might follow suit. For now, the 200 SMA also seems to be holding as dynamic resistance at the 38.2% Fib.
Natural gas continues to enjoy its seasonal bounce on a combination of lower output due to the hurricane season and stronger demand on cooling weather conditions. At the same time, improving risk sentiment on account of easing trade tensions is lifting commodities. It also helps that most major central banks are starting to ease monetary policy to provide economic stimulus, as this would likely translate to stronger business investment and purchases of commodities.
Up ahead, the EIA inventory report might provide some short-term volatility as a large increase in stockpiles could lead to a short-term dip while a reduction could extend the climb.