
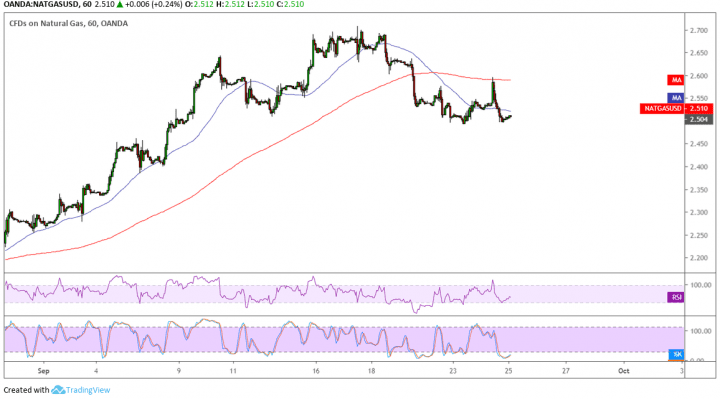
Natural gas formed a head and shoulders pattern on its 1-hour time frame, and price looks ready to break below the neckline at the $2.500 mark. If so, a selloff that’s the same height as the chart pattern could follow.
The 100 SMA is below the 200 SMA to indicate that the path of least resistance is to the downside or that the selloff is more likely to gain traction than to reverse. The 200 SMA also recently held as dynamic resistance and price is below the 100 SMA dynamic inflection point, which means that this could also keep gains in check from here.

The head and shoulders pattern spans $2.500 to around $2.700 so the resulting selloff could be of the same height. In other words, this could take natural gas to $2.300 next.
RSI is turning higher without even dipping to the oversold region, indicating that buyers are eager to return. Stochastic is already in the oversold region and is just about to pull up to confirm that bullish momentum is returning. In that case, price might still bounce back to the area of interest at $2.500-2.600.
The upcoming release of inventory data could determine whether or not natural gas could confirm this head and shoulders pattern, and a build of 90 Bcf is expected. Keep in mind that the current month is on track to being the hottest September since 2000, which suggests weaker demand for heating commodities.
Still, it’s worth noting that natural gas is in the middle of its so-called seasonal bounce, which lines up with the start of the hurricane season in the US that typically hits supply. At the same time, this marks the start of cooler weather conditions, which then see a pickup in demand for heating commodities.