
NZDJPY has been trading within a long-term range between support at 85.61 and resistance at 88.14 for the past several months, with price oscillating between these boundaries as bulls and bears battle for control.
The pair recently bounced off the range support and is currently trading around 87.40, approaching the midpoint of the range. Price appears to be testing the area around the 100 SMA (blue line) and 200 SMA (red line), which could serve as dynamic resistance on further rallies.

If bullish momentum persists, NZDJPY could make its way up to the range top at 88.14, where sellers might be inclined to defend this ceiling. A strong bounce off this resistance level could send the pair back down to test support at 85.61 once more, keeping the range-bound behavior intact.
On the other hand, a decisive break above 88.14 could signal a shift in longer-term trend direction, potentially opening the door for a sustained climb to fresh highs. Conversely, a breakdown below the 85.61 support zone might set off a steeper selloff.
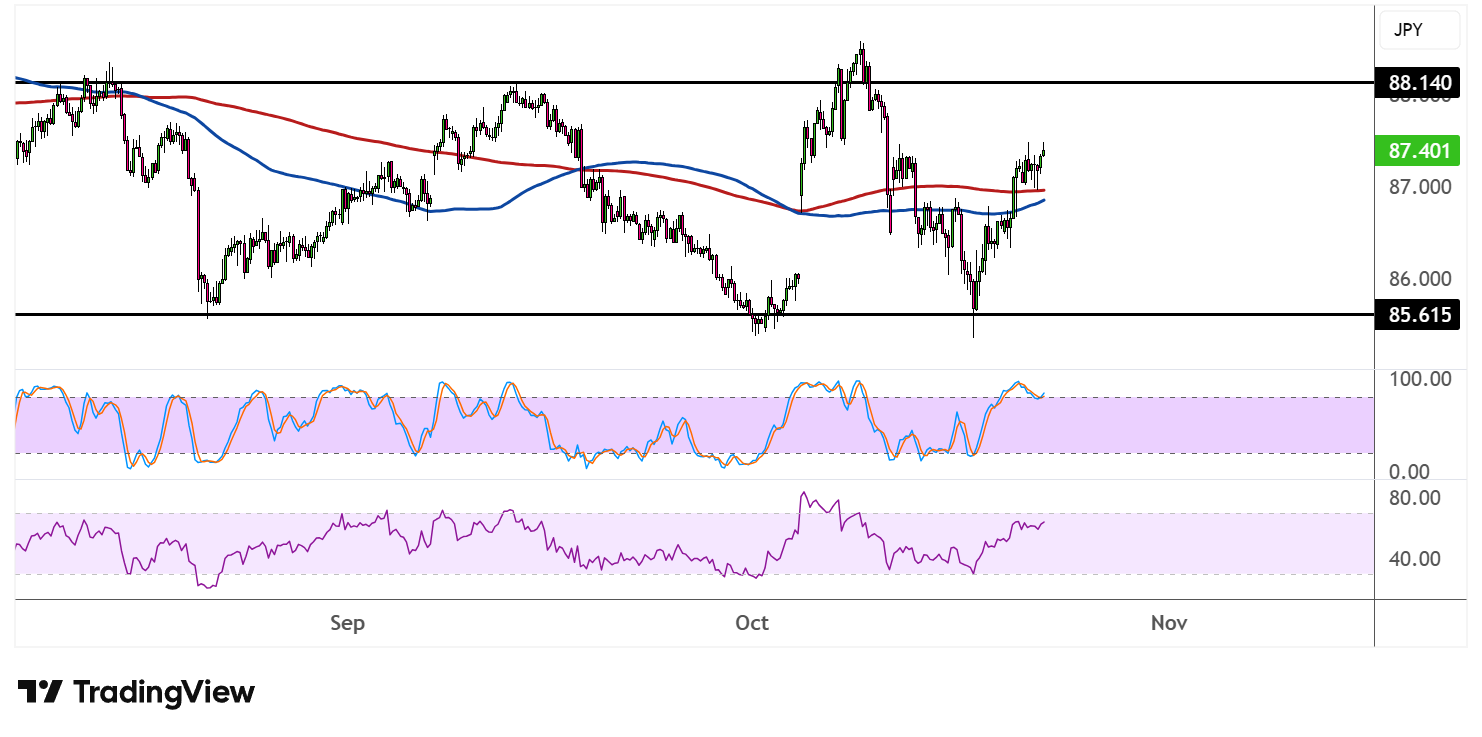
The 100 SMA is currently sitting just below the 200 SMA, suggesting that bearish pressure has been in play, although the gap between the indicators appears to be narrowing. A potential bullish crossover could indicate that the path of least resistance is shifting to the upside.
Stochastic is climbing from the middle ground, reflecting building bullish momentum for now. The oscillator has room to reach the overbought region before exhaustion sets in, so buyers could stay in control for a bit longer.
RSI is also trending higher and has room to climb before reaching the overbought zone, indicating that price could keep following suit while buyers have the upper hand.
NZDJPY could take cues from risk sentiment and central bank expectations. Any hawkish surprises from the RBNZ or dovish signals from the BOJ might support upside attempts, while risk-off flows could keep the pair under pressure near range highs.