
NZDJPY has been carving out a descending triangle pattern on its short-term time frame, as the pair continues to print lower highs connected by a descending trendline while finding support around the 92.19 horizontal floor.
Price is currently trading around the 92.57 level, hovering just above this critical support zone as the formation nears completion. The descending trendline has been capping rallies consistently, reflecting sustained selling pressure on bounces.

If the horizontal support at 92.19 manages to hold as a floor, NZD/JPY could stage a recovery toward the descending trendline resistance, now converging near the 93.00 major psychological area. A stronger bullish push could extend gains toward the swing high around the 94.00 mark or higher, though sellers would likely be waiting at these levels to defend the broader downtrend.
On the other hand, a decisive break below the 92.19 support could confirm the descending triangle breakdown and set off a sharper decline. The measured move from the formation suggests that sellers could drive the pair down toward the 91.00 major psychological area or potentially lower if bearish momentum picks up.
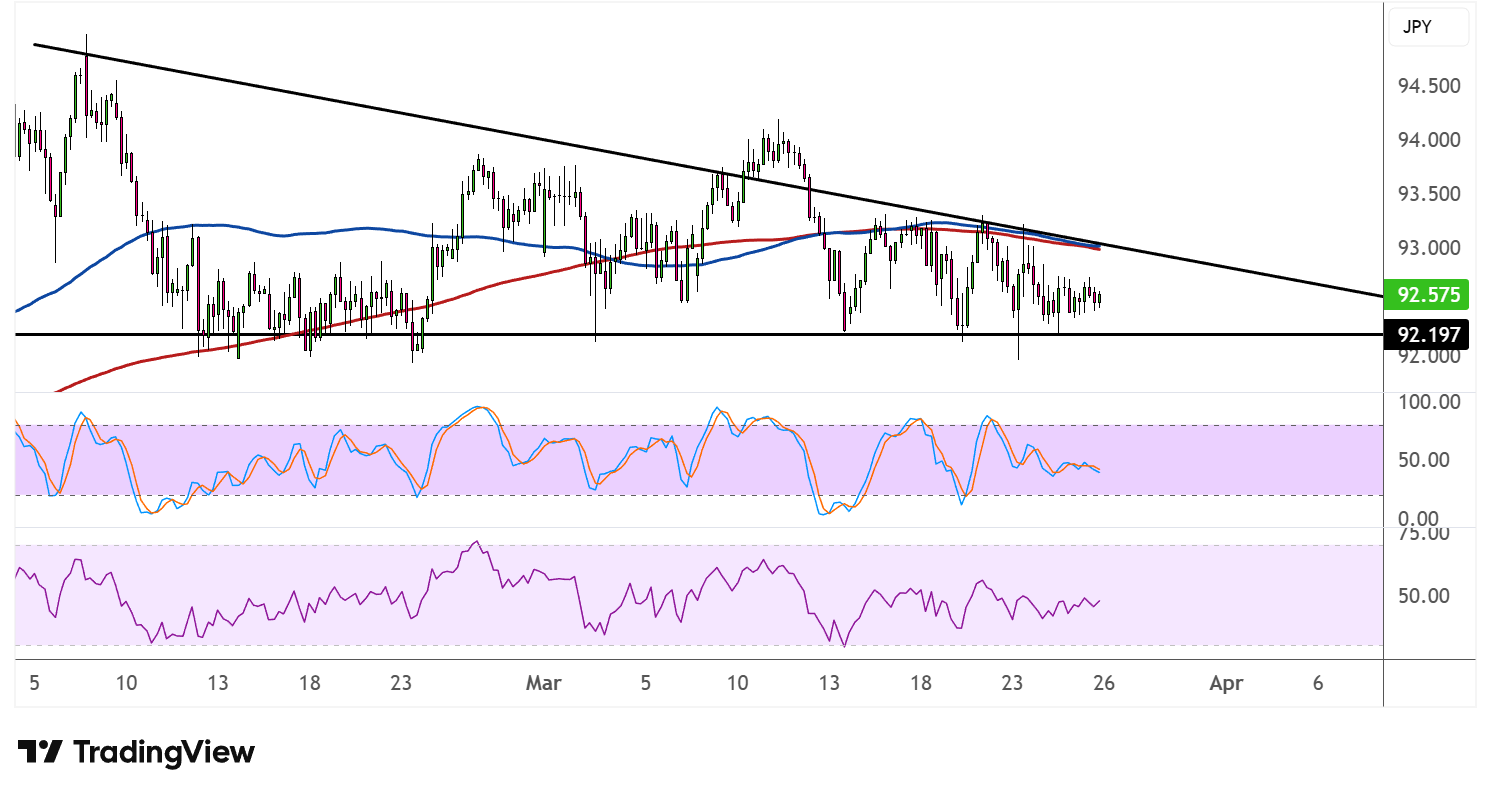
The 100 SMA has crossed below the 200 SMA, confirming that the path of least resistance is to the downside and that the selloff is more likely to gain traction than to reverse. Both indicators are also converging near current price levels and could act as dynamic resistance on any corrective bounces.
Stochastic is hovering in the middle ground after pulling back from the overbought region, leaving room to slide further before reaching the oversold area. This suggests that sellers still have some breathing room to push the pair lower.
RSI is similarly treading in neutral territory without a clear directional signal, though any further weakness could tip the oscillator toward the oversold zone, potentially accompanying a breakdown below support.