
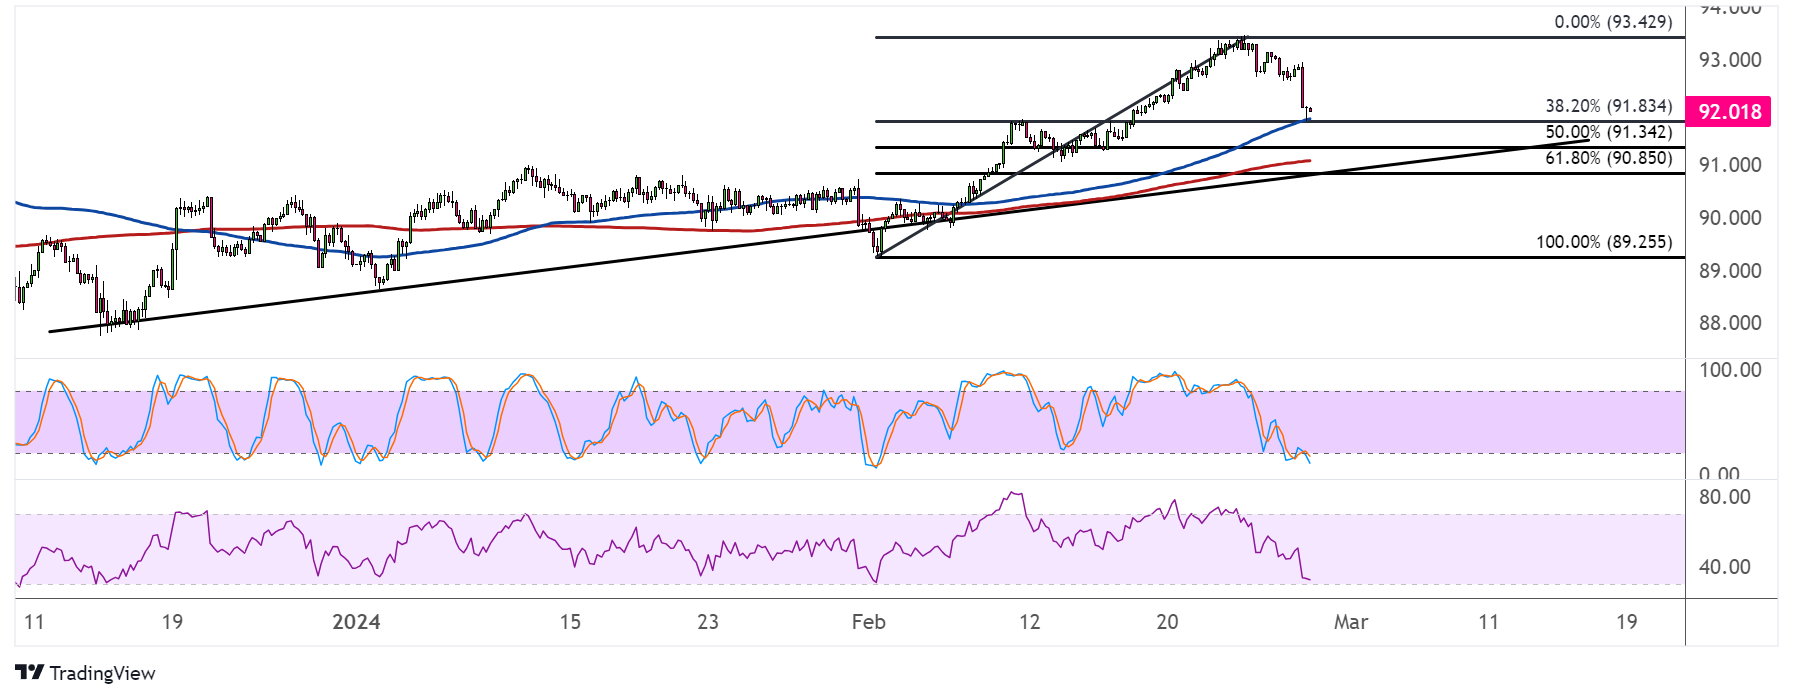
NZDJPY has formed higher lows connected by an ascending trend line visible on the 4-hour time frame. Price looks ready for another dip to support, which happens to line up with Fibonacci retracement levels.
The pair is already testing the 38.2% level that lines up with the 100 SMA dynamic support. If this is enough to keep losses in check, NZDJPY could resume the climb to the swing high at 93.43 or higher.

A larger correction could find more buyers at the 50% Fib or the 61.8% level closer to the trend line support and 200 SMA dynamic inflection point near 91.00.
The 100 SMA is above the 200 SMA to suggest that the path of least resistance is to the upside or that support is more likely to hold than to break. The gap between the moving averages is widening to reflect strengthening bullish momentum as well.
Stochastic is heading down but already dipping into the oversold region to signal exhaustion among sellers. Turning back up would mean that buyers are ready to return and allow the uptrend to resume.
Similarly RSI is closing in on the oversold region but has a bit more room to head south, so the correction might keep going until the oscillator pulls back up.
NZDJPY sold off after the RBNZ decision seemed less hawkish than expected. Some expected some talk of tightening since data remained upbeat, but the central bank appeared to hint that interest rates have already peaked.
However, risk-on flows might still benefit the Kiwi in the near-term, especially if data from the US disappoints. After all, weak figures could support the idea of earlier Fed rate cuts, which might boost risk assets versus the US dollar.
As for the yen, the BOJ remains decidedly dovish, citing that they are in no rush to tighten policy aggressively even after they exit negative rates.