
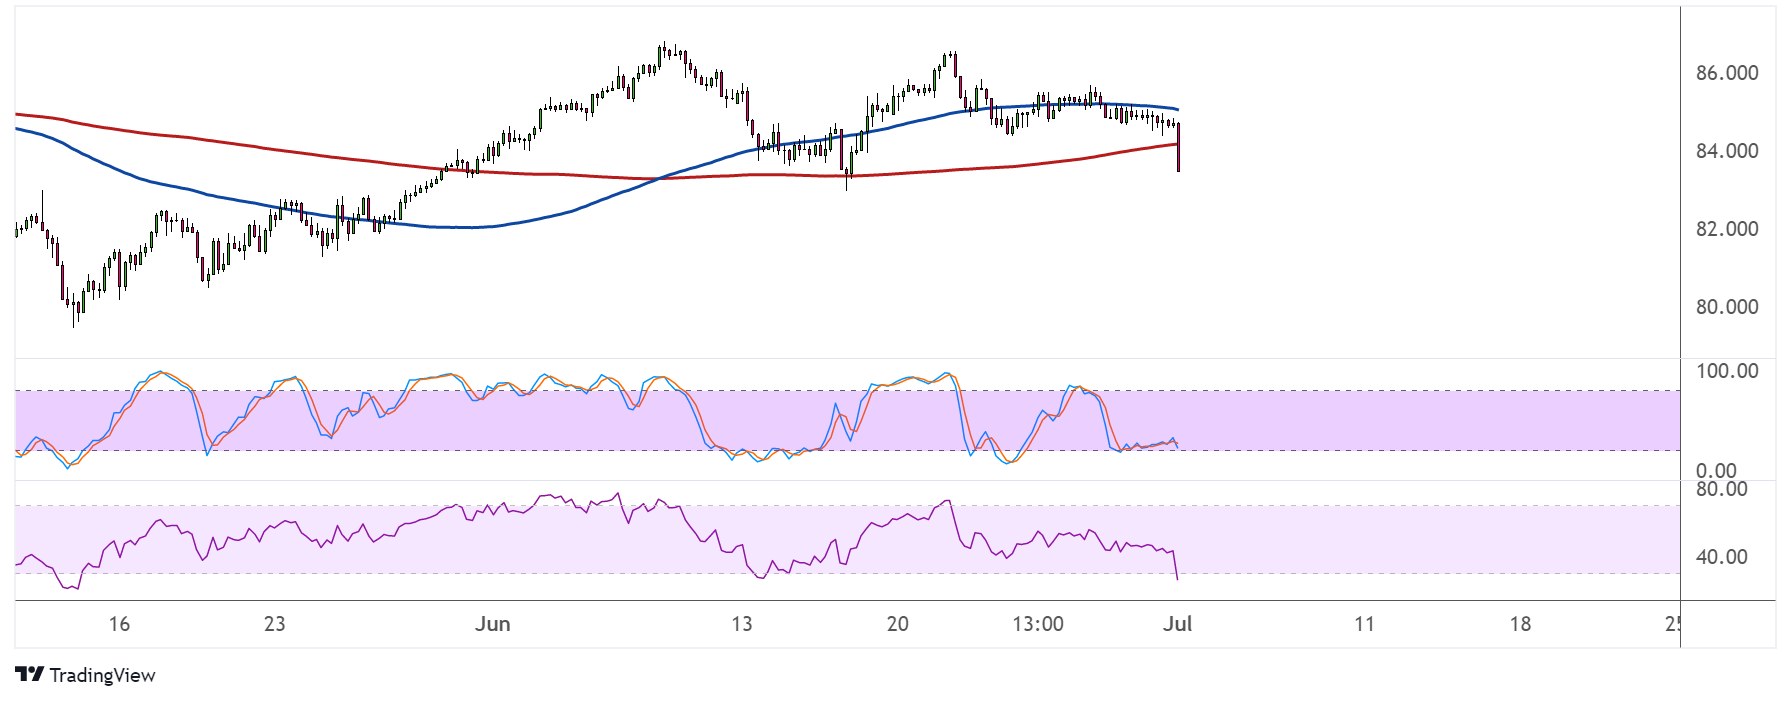
NZDJPY might be in for a reversal from its uptrend, as the pair is inching closer to testing the neckline of its double top pattern. A break below support could set off a downtrend that’s the same height as the chart formation or around 250 pips.
The 100 SMA is still above the 200 SMA to indicate that the path of least resistance is to the upside or that support is more likely to hold than to break. In that case, the pair could still bounce back to the highs around 86.50 to 87.00.

However, NZDJPY is breaking below both moving averages as an early indicator of selling pressure. The gap between the indicators is narrowing as well, so a bearish crossover might be looming.
Stochastic is already on the move up, though, so buyers might be taking over while sellers take a break. RSI is heading south, so there may still be some selling pressure left, but the oscillator is also closing in on the oversold region.
Earlier on, Japan’s Tankan survey printed mixed results, with the manufacturing component falling from 14 to 9 and the non-manufacturing figure improving from 9 to 13.
There are no major reports from both New Zealand and Japan for the rest of the week, so any breakout moves might hinge on overall market sentiment. A pickup in risk-off flows stemming from recession fears might weigh on the commodity-related Kiwi while favoring the safe-haven yen.
On the other hand, a return in risk-taking could spur a bounce for NZDJPY since this would drive traders towards higher-yielding assets.
Keep in mind, however, that higher borrowing costs due to consecutive central bank rate hikes would likely dampen business and consumer spending in the coming months. In turn, this keeps a lid on investor optimism and demand for riskier holdings, as well as purchases of raw materials and commodities.