
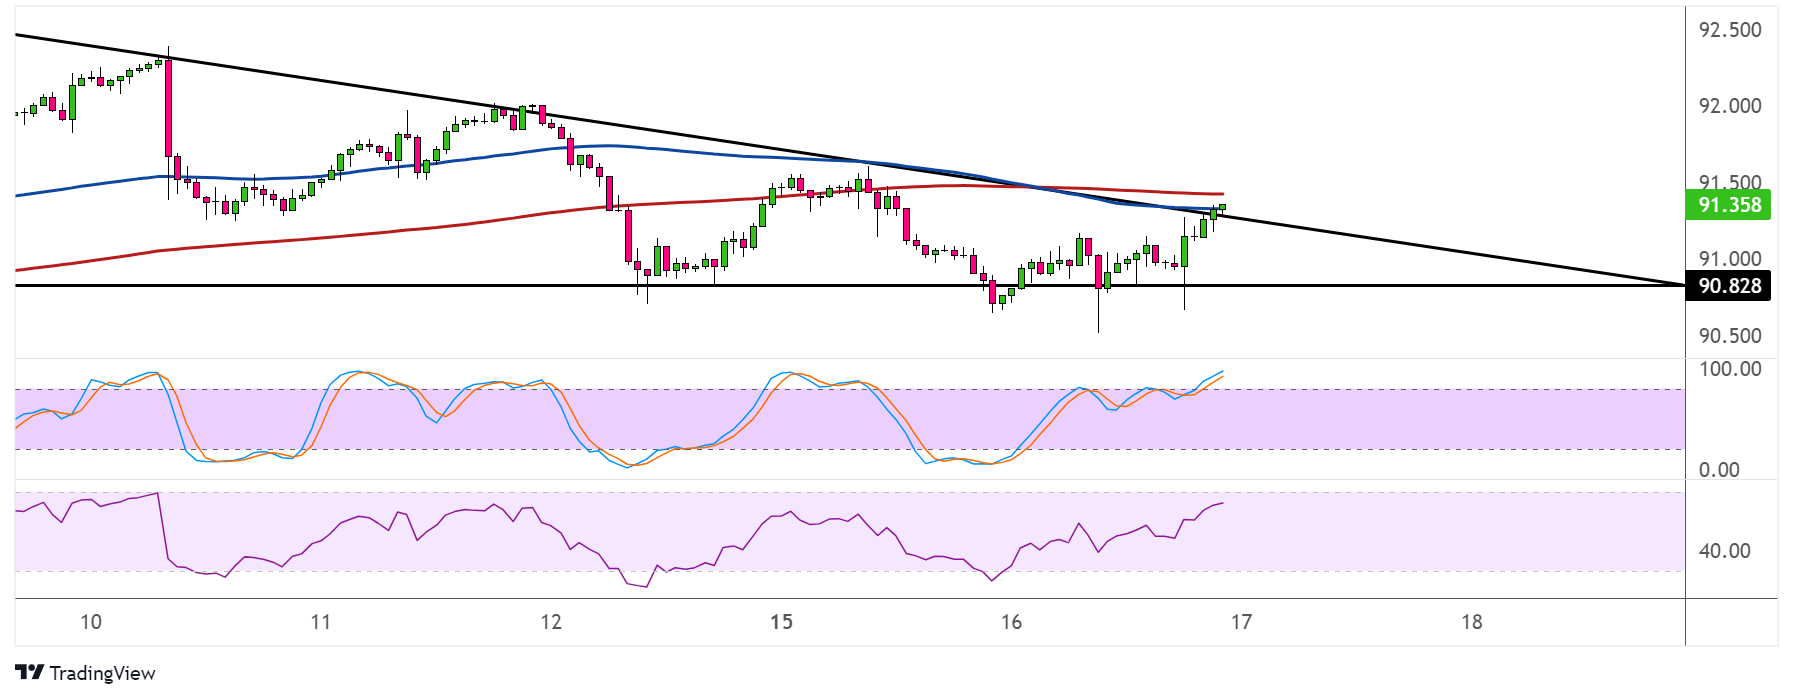
NZDJPY has formed lower highs and found support at the 91.00 major psychological mark, creating a descending triangle pattern on its hourly chart. Price seems to be going for a bullish breakout.
If that’s the case, NZDJPY could be in for a rally that’s the same height as the chart formation or around 100 pips. The 100 SMA is below the 200 SMA for now, though, so resistance is more likely to hold than to break.

In that case, the pair could fall back to the lows or even go for a bearish break, triggering a drop that’s the same height as the triangle. The moving averages also line up with the triangle top to add to its strength as resistance.
Stochastic is climbing but already in the overbought zone to signal exhaustion among buyers, so turning lower would mean a return in selling pressure. RSI has some room to climb before indicating overbought conditions, so bullish momentum might still stay in play.
Earlier today, New Zealand’s quarterly CPI came in line with estimates of a 0.6% uptick versus the earlier 0.5% gain. Analysts say that this is enough for the RBNZ to keep sitting on its hands for much longer instead of considering interest rate cuts like most major central banks.
Meanwhile, the BOJ remains decidedly dovish since they mentioned that their latest rate hike isn’t likely to be followed by aggressive tightening moves. Nonetheless, the prospect of BOJ intervention on further JPY weakness might limit the downside.
Besides, persistent risk-off flows might be enough to keep the yen supported versus the higher-yielding Kiwi, as traders remain wary of geopolitical tensions. Many are on the lookout for retaliatory measures between Iran and Israel, as the prospect of another major war might mean significant downside for commodities and financial markets.