AUD/CAD Symmetrical Triangle, Ready to Break Out Soon?
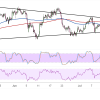
AUDCAD has been carving out a symmetrical triangle pattern since mid-May, with a descending trend line connecting lower highs and an ascending trend line connecting higher lows.

AUDCAD has been carving out a symmetrical triangle pattern since mid-May, with a descending trend line connecting lower highs and an ascending trend line connecting higher lows.
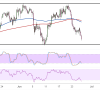
AUDCAD has been oscillating within a range on the short-term time frame, with the pair now making its way down to test the floor of the formation around the 0.9750 minor psychological level.
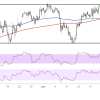
AUDCAD has been oscillating within a broad range for several weeks, with the ceiling around the 0.9900 major psychological level continuing to hold firm against repeated tests.
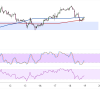
AUDCAD appears to have formed a double top chart pattern after failing to sustain gains above the 0.9700 major psychological level on two separate occasions.
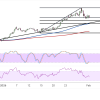
AUDCAD has been trading in an uptrend, with price respecting the rising trend line support that’s been holding since mid-December.
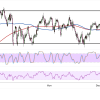
AUDCAD has been trading inside a range pattern on its daily time frame, bouncing between support at 0.9075 and resistance around 0.9225.
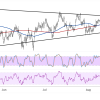
AUDCAD has been consolidating within a well-defined symmetrical triangle formation over the past several months, with converging trend lines creating a narrowing trading range as the pair approaches a critical decision point near the 0.89718 level.
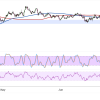
AUDCAD is forming a head and shoulders pattern to indicate exhaustion from the earlier uptrend and is currently trading at 0.8813.