Posts Tagged: nzdjpy
NZDJPY has been stuck inside a broad range since February, bounded by resistance at the 95.00 psychological level and support at the 91.00 mark, and the pair is now sliding back down toward the lower boundary after a sharp pullback from the top of the range.
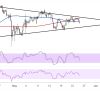
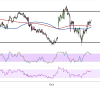
NZDJPY has been carving out a symmetrical triangle pattern on the short-term time frame, with lower highs and higher lows converging toward an eventual breakout.
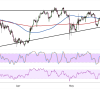
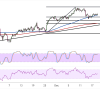
NZDJPY has been forming an ascending triangle pattern on the short-term time frame, with the pair carving out a series of higher lows along a rising trend line support while repeatedly running into a ceiling near the 94.00 major psychological level.
NZDJPY has broken below a key horizontal support zone and is currently staging a pullback to what could now act as resistance, with price hovering around the 92.38 level.
NZDJPY has been carving out a descending triangle pattern on its short-term time frame, as the pair continues to print lower highs connected by a descending trendline while finding support around the 92.19 horizontal floor.
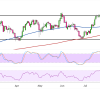
NZDJPY has been trading above an ascending trend line visible on its short-term chart, and price is currently testing support around the 89.87 level.
NZDJPY has been trading within a long-term range between support at 85.61 and resistance at 88.14 for the past several months, with price oscillating between these boundaries as bulls and bears battle for control.
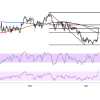
NZDJPY is currently trading at 84.770, bouncing between key Fibonacci retracement levels following a significant pullback from recent highs. The pair has been moving within an ascending channel pattern, which suggests the overall trend remains bullish despite recent downside pressure.