
The US dollar currency index on Wednesday pulled back from the current multi-year highs set on Tuesday to trade at about 100.342. The USDX seems to be trading within a sharply descending channel formation in the 60-min chart.
As a result, the DXY has plummeted to trade below the 100-hour moving average line. However, the dollar currency index managed to mount a late recovery on Wednesday, preventing it from falling to the oversold conditions of the 14-hour RSI.
The US Dollar Index Fundamentals Overview

From a fundamental perspective, the USDX is trading at the back of a relatively busy period in the US market. On Wednesday, US benchmark 10-year yields slid to 2.8455% shading 7 basis points after peaking at a high of 3%. Erik Bregar, director, FX & precious metals risk management at Silver Gold Bull in Toronto said that the US10YT=RR backed off after hitting new 3-year highs, gifting ground to competing currencies like the Japanese Yen.
The US market also reported unfavourable data relating to existing homes sales for March, which missed the expected (MoM) tally of 5.8 million with a count of 5.77 million. Earlier in the week, US building permits for March beat the expectation of 1.825 million with 1.873 million (MoM), while housing starts for the period also outshone the ex[pected (MoM) tally of 1.745 million with a count of 1.793 million. Traders will be looking forward to Thursday’s initial and continuing jobless claims numbers.
The US Dollar Index Technical Analysis (the 60-min Chart)
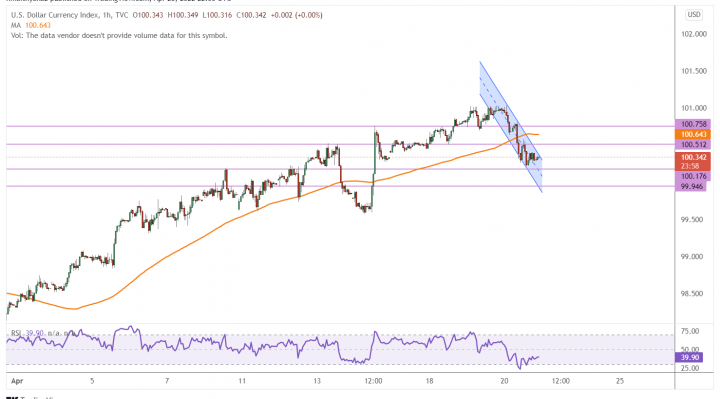
Technically, the US dollar index appears to be trading within a sharply descending channel formation in the 60-min chart. This indicates a strong short-term bearish bias in the market sentiment.
Therefore, the bears will be looking to ride the current declines towards 100.176 or lower to 99.946. On the other hand, the bulls will be targeting short-term rebound profits at about 100.512, or higher at 100.758.
The US Dollar Index Technical Analysis (the Daily Chart)
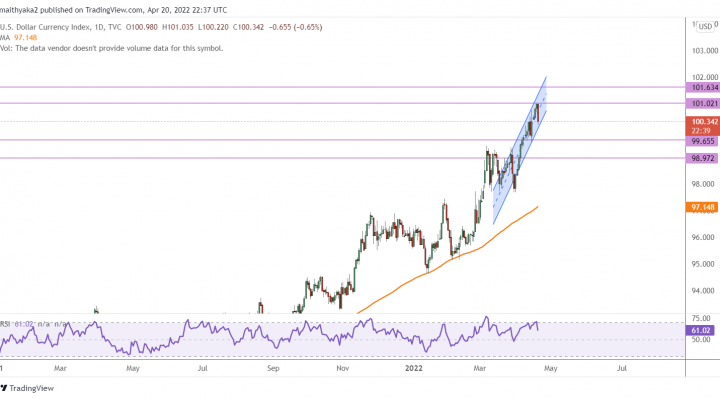
In the daily chart, the USDX seems to be trading within a sharply ascending channel formation. This indicates a strong long-term bullish bias in the market sentiment.
Therefore, the bulls will be looking to ride the current rally towards 101.021 or higher to 101.634. On the other hand, the bears will be targeting potential long-term pullbacks at about 99.655, or lower at 98.972.