
The US Dollar Index (DXY) on Friday rallied to hit new yearly highs of about 97.60 before pulling back late on to settle at 97.36 after the NFPs. The USDX has been on a bullish run since the start of the year and now looks set to complete a XABCD double-bottom reversal pattern, albeit in a descending Pitchfan.
The Dollar Index has recently bounced off overbought levels of the RSI indicator in the 60-min chart and this could lead to more declines in the coming days.
The US Dollar Index Fundamentals Overview

From a fundamental perspective, the dollar index is trading at the back of a relatively busy week in the US market. Towards the end of last week, the US-Iran conflict intensified and this triggered a major pullback in the DXY. However, things have eased a little this week thereby putting off the threat of escalation. This sparked the rebound that culminated with the dollar index hitting a new yearly high.
However, on Friday, the US non-farm payrolls data for December disappointed after missing out the expectation of 164k jobs with 156k. Average hourly wage growth also came short of the forecast with a 2.9% growth for December versus 3.1%. This was also a significant decline from the average growth of 3.1% in November.
Earlier in the week, the US ISM non-Manufacturing PMI for December beat the expectation of 54.5 with 55. The Markit Manufacturing PMIs also impressed while the ADP unemployment change beat 160k with 202k. Initial jobless claims beat expectations while continuing claims disappointed.
The US Dollar Index Technical Analysis (the 60-min Chart)
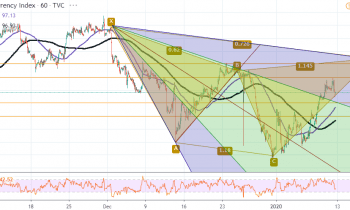
Technically, the US Dollar Index appears to be experiencing short-term bullish pressure in the market sentiment after a sustained period of gains. However, on Friday, that rally faced strong resistance around the 97.60 level prompting a pullback.
Therefore, the bears will be targeting short-term profits at around 97.20 or lower at 97.00 going into next week. On the other hand, the bulls will look to pounce on profits at around 97.60 or higher at 97.80.
The US Dollar Index Technical Analysis (the Daily Chart)
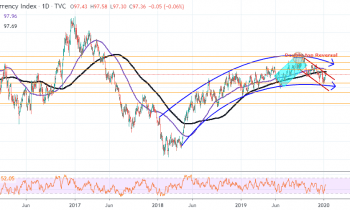
In the daily chart, the USDX appears to be trading in a descending channel coming off a relatively bullish curve. This indicates that the bears are trying to take control of the DXY from the bulls after triggering a double-top reversal pattern.
Therefore, the bears will be targeting long-term profits at around 96.30, 95.15 or lower at 94.17 going into next week. On the other hand, the bulls will try to retain control by targeting profits at around 97.73, 98.52 or higher at 99.43.