
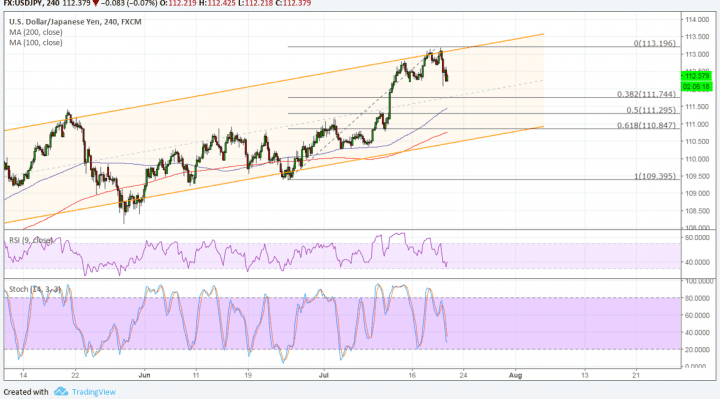
USD/JPY has been on a steady climb as it trades inside an ascending channel on the 4-hour time frame. Price already made its way to the resistance and appears to be gearing up for a pullback before regaining traction.
Using the Fibonacci retracement tool shows the next support zones. The 61.8% level is closest to the channel bottom around 111.00, a former resistance, and the 200 SMA dynamic support. The 38.2% level is around the mid-channel area of interest at 111.75 while the 50% Fib lines up with the 100 SMA.

The 100 SMA is above the longer-term 200 SMA to indicate that the path of least resistance is to the upside. In other words, the uptrend is more likely to resume than to reverse. The gap between the two is also slightly widening to reflect stronger bullish momentum.
However, RSI is still pointing down to show that bearish pressure is in play. This could carry on until the oscillator reaches oversold levels and turns back up to signal exhaustion among sellers. Similarly stochastic has some room to slide before hitting oversold levels and drawing buyers back in.
The dollar got knocked down from its highs after US President Trump made comments in a CNBC interview blaming Fed tightening for nullifying some of the progress made in economic growth. He said that higher interest rates and a strong dollar put the US economy at a disadvantage.
This allowed the yen to take some of the safe-haven flows in recent trading sessions while traders steered clear of the dollar for fear of seeing the Fed’s independence under threat. Still, it’s worth noting that US data has been coming in mostly stronger than expected, keeping the central bank on track towards more tightening moves.
There are no major reports due from both economies for the rest of the trading week, so some profit-taking off the recent dollar rallies could take place.