
USDCAD has been trading in a steady downtrend, with the pair gearing up for another test of the falling resistance zone on the long-term chart.
Recent price action has formed a series of lower highs and lower lows, confirming the bearish structure that has dominated the pair’s trajectory over the past several months.

However, the current consolidation near key support suggests that a corrective bounce could be materializing, potentially targeting the upper resistance zones.
Moving average analysis reveals that the 100 SMA remains below the 200 SMA, indicating that the path of least resistance continues to point to the downside.
This bearish crossover configuration suggests that any rallies are likely to be viewed as selling opportunities rather than the start of a broader trend reversal. Price is currently trading below both dynamic resistance levels, reinforcing the overall negative bias.
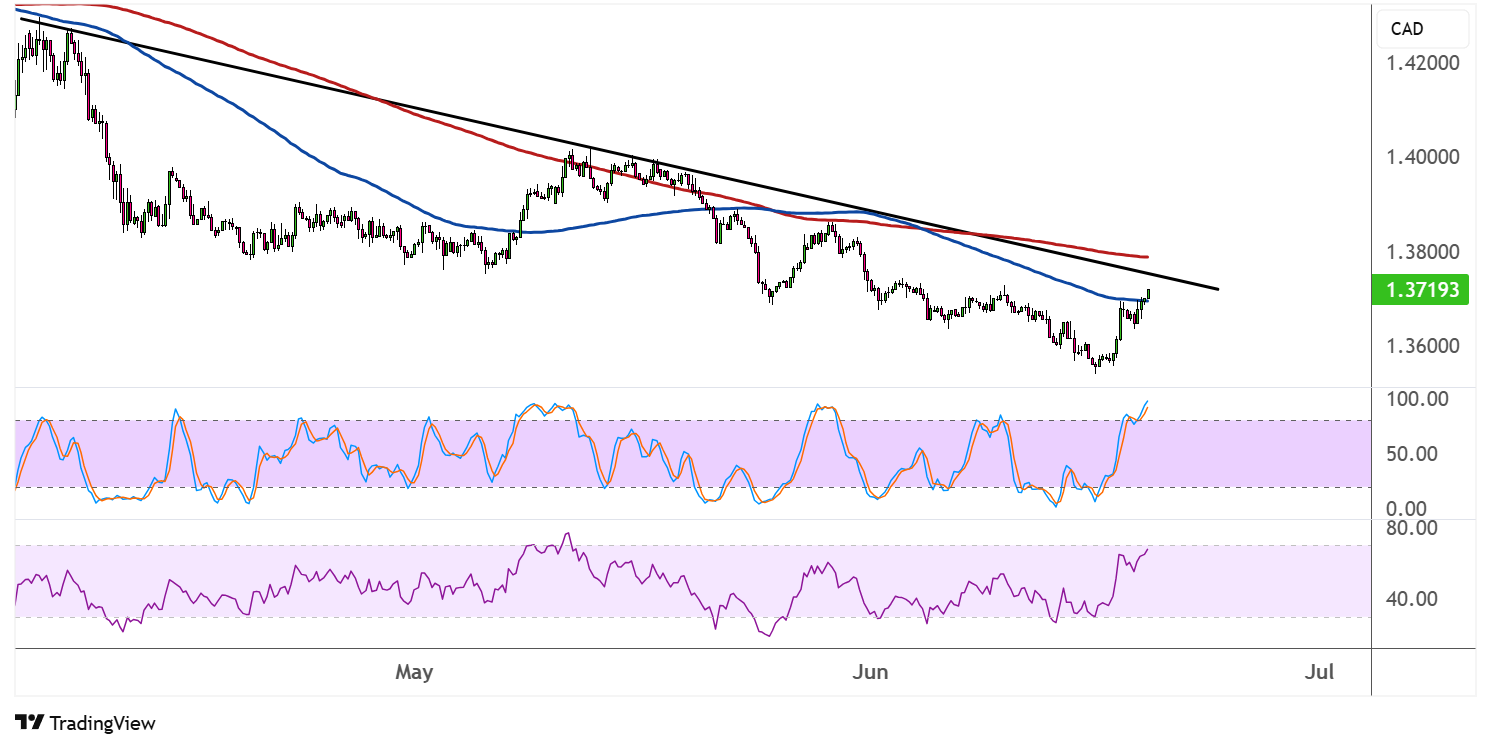
Momentum indicators are showing early signs of a potential shift in sentiment. The stochastic oscillator is emerging from oversold territory and beginning to trend higher, reflecting growing bullish momentum in the near term. This development suggests that selling pressure may be starting to ease.
Meanwhile, the RSI has some room to climb before reaching overbought levels, indicating that the current bounce could have further upside potential. However, traders should remain cautious as the broader trend structure remains intact, and any rallies are likely to face strong resistance at key technical levels.
USDCAD could continue to take cues from oil prices, as the oil-related Loonie has seen additional volatility in reaction to developments in the Israel-Iran conflict. Indications that the US is ready with plans to strike as soon as directed are keeping investors on edge about global supply, although there have been reports that Iran’s oil facilities have avoided immediate damage for the time being.