
USD/JPY has been exhibiting bearish momentum over the recent weeks, with price action falling below both the 100 and 200 Simple Moving Averages (SMA), suggesting a potential shift in the longer-term trend.
The currency pair is currently trading at 146.267, having declined significantly from the 150.000 psychological level. This recent drop follows what appears to be head and shoulders formation between July 2024 and early 2025, signaling bearish sentiment.

From a moving average perspective, the 100 SMA (blue line) has crossed below the 200 SMA (red line), confirming a bearish crossover that typically indicates sustained downward pressure. This technical signal reinforces the view that sellers have gained control of the market direction.
A break below the head and shoulders neckline around the 140.00-142.00 levels could confirm that bearish forces are taking hold, possibly leading to a long-term slide that’s the same height as the formation.
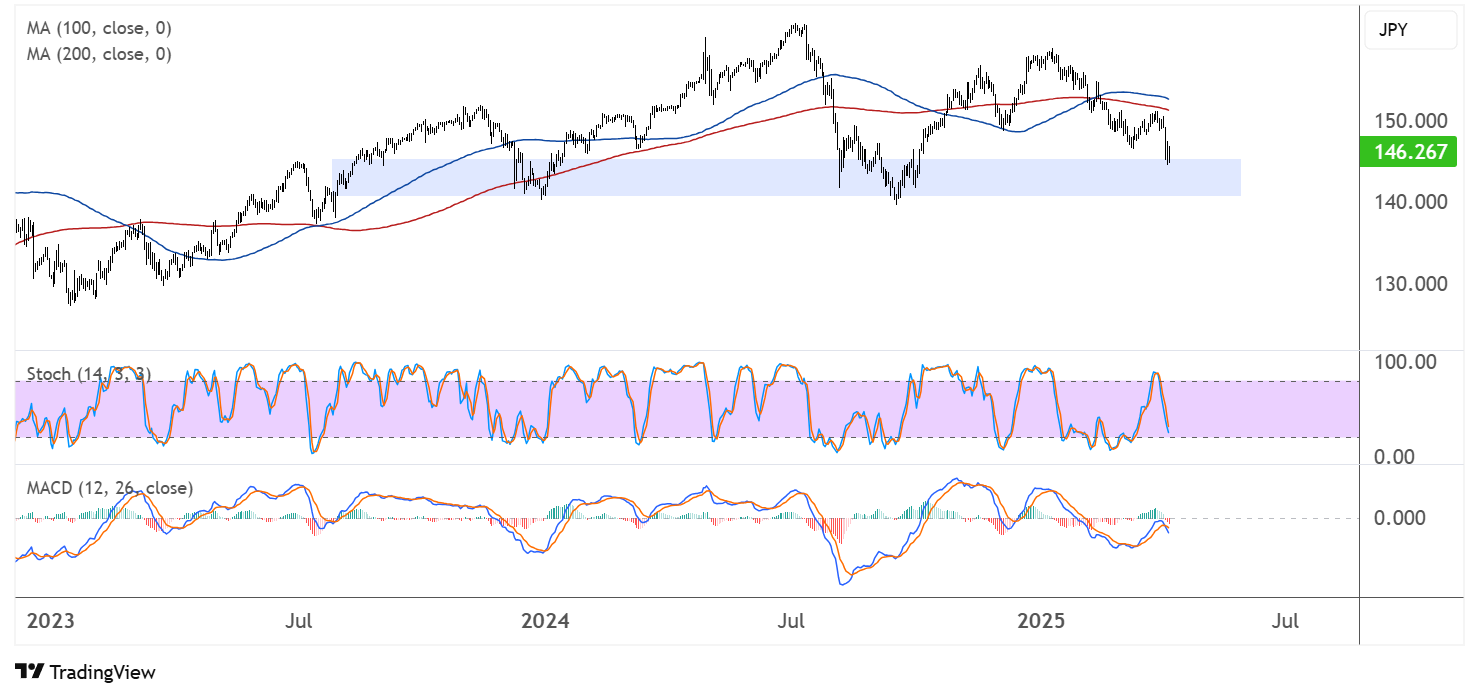
The stochastic oscillator (14/3/3) is currently hovering in the mid-range, showing neither overbought nor oversold conditions, but appears to be trending lower.
Meanwhile, the MACD (12, 26, close) shows decreasing bearish momentum with signs of potential convergence, which could indicate diminishing selling pressure in the near term.
Key support levels to watch include the 145.000 area, followed by the 140.000 psychological level. If current support fails, we could see a prolonged bearish trend for USDJPY.
For any potential recovery, USD/JPY would need to reclaim the 150.000 resistance level, which aligns with the 100 SMA. A decisive break above this zone could signal a return to bullish sentiment and possibly target the previous swing high near 152.000.
Traders should be aware that the recent downward movement has been quite steep, and a short-term pullback could emerge as the pair approaches oversold territory. However, the overall technical structure remains bearish as long as price stays below both key moving averages. Top-tier catalysts to watch out for include the FOMC meeting minutes and US CPI release.