
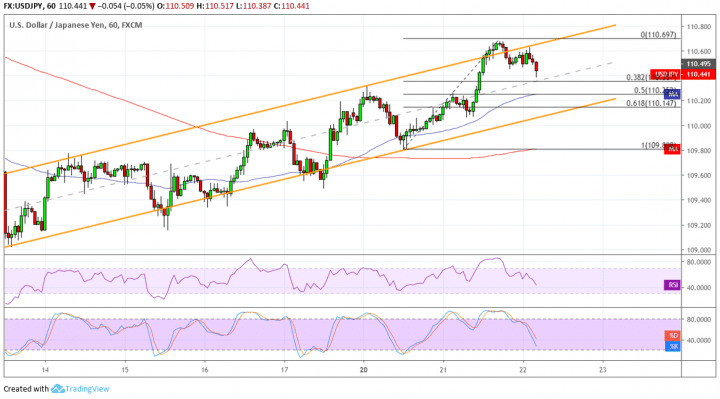
USDJPY is trending higher and forming higher lows and higher highs inside a rising channel on its 1-hour chart. Price is testing the resistance and might be due for a pullback to support again.
Applying the Fibonacci retracement tool shows the potential support levels. The 61.8% Fib is closest to the channel bottom around 110.15 while the 50% Fib is closer to the 110.25 mark and 100 SMA dynamic inflection point. The 38.2% level is in line with the mid-channel area of interest and could be enough to keep losses at bay in a shallow correction.

The 100 SMA is above the longer-term 200 SMA to indicate that the path of least resistance is to the upside or that the climb is more likely to gain traction than to reverse. The gap between the indicators is also widening to reflect stronger bullish momentum.
RSI is still pointing down to reflect the presence of selling pressure, and the oscillator has yet to cross the center line to confirm the downtrend. Stochastic has also done this, indicating that bearish momentum is in play and could keep going until oversold conditions are met. Both oscillators have plenty of room to head south, so USDJPY might follow suit.
The FOMC minutes are up for release in the upcoming US session, possibly injecting more volatility for this pair. Keep in mind that Fed officials have stuck to their bias of keeping rates unchanged for the rest of the year, and seeing the factors that influenced this decision could drive the dollar lower.
At the same time, trade tensions with China are keeping traders wary of the Greenback as retaliatory measures could wind up doing more damage on the US economy. Meanwhile, the yen might be poised to take advantage of safe-haven flows instead.