
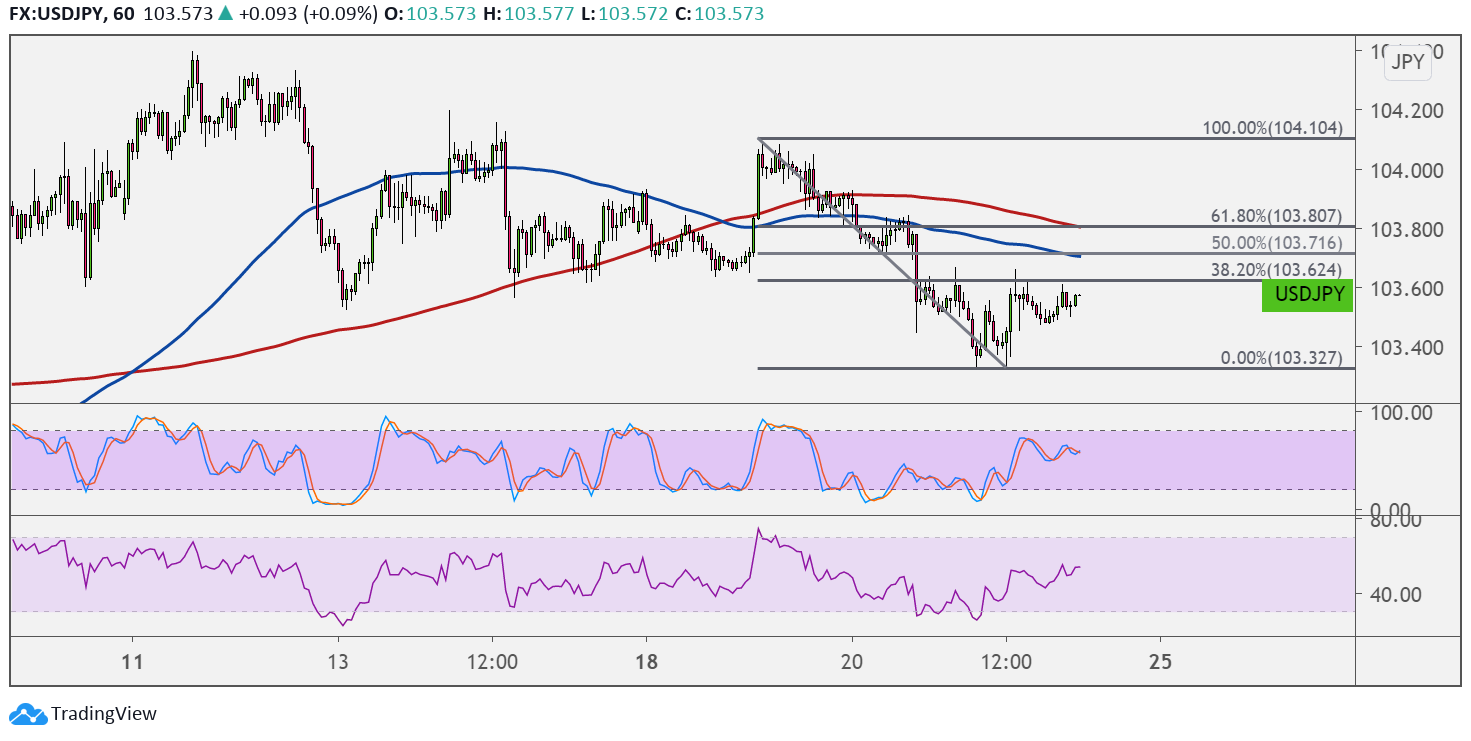
USDJPY recently fell through support at the 103.65 level and is pulling up for a retest after hitting a low of 103.33. Applying the Fibonacci retracement tool shows that the 38.2% level lines up with this area of interest.
The 50% level is also around the former support zone and lines up with the 100 SMA dynamic resistance that adds to its strength as a ceiling. A larger correction could last until the 61.8% Fib near the 200 SMA dynamic inflection point at 103.80.

The 100 SMA is below the 200 SMA to confirm that the path of least resistance is to the downside or that the selloff is likely to resume. A break past the Fib levels, however, might suggest that buyers have taken the upper hand.
Stochastic looks ready to top out without reaching the overbought zone, hinting that sellers are eager to take over. RSI has more room to climb and could continue to head north, so price could follow suit while buyers have some energy left. If any of the Fibs are able to keep gains in check, price could resume the slide to the swing low or lower.
The US currency appears to have made a small relief rally following the Presidential inauguration and Biden’s productive first day in office. However, the gains could be short-lived as traders return their focus to the COVID-19 cases in the country.
Meanwhile, the BOJ upgraded its forecasts for next year as the central bank refrained from easing policy in their latest meeting. Still, the prospect of the Tokyo Olympics being cancelled this year could mean a lot of losses for the Japanese government and therefore their currency.
There are no major reports from both the US and Japan for the rest of the trading week, so risk sentiment might be the main driver of price action.