
USDJPY has broken out of an ascending triangle pattern to the upside, signaling that bullish momentum has returned after a period of consolidation.
Price surged from the triangle’s apex near the 159.28 level and pushed toward a swing high around 160.80 before pulling back to its current level of 159.72, suggesting a corrective phase may now be underway.

The pullback appears to be testing the 0% Fibonacci level at 159.28, which also aligns closely with the triangle’s broken upper trendline — a classic case of former resistance flipping to support. If this area holds as a floor, USDJPY could gather enough bullish momentum to resume the climb toward the upper Fibonacci targets.
The Fibonacci extension tool maps out the key upside objectives from here. The 38.2% level at 160.23 represents the nearest resistance, followed by the 50% level at 160.53. A stronger push higher could bring the 61.8% Fib at 160.82 into play, while the 76.4% extension at 161.18 and the full measured target at 161.775 would come into focus if buyers manage to build on their momentum.
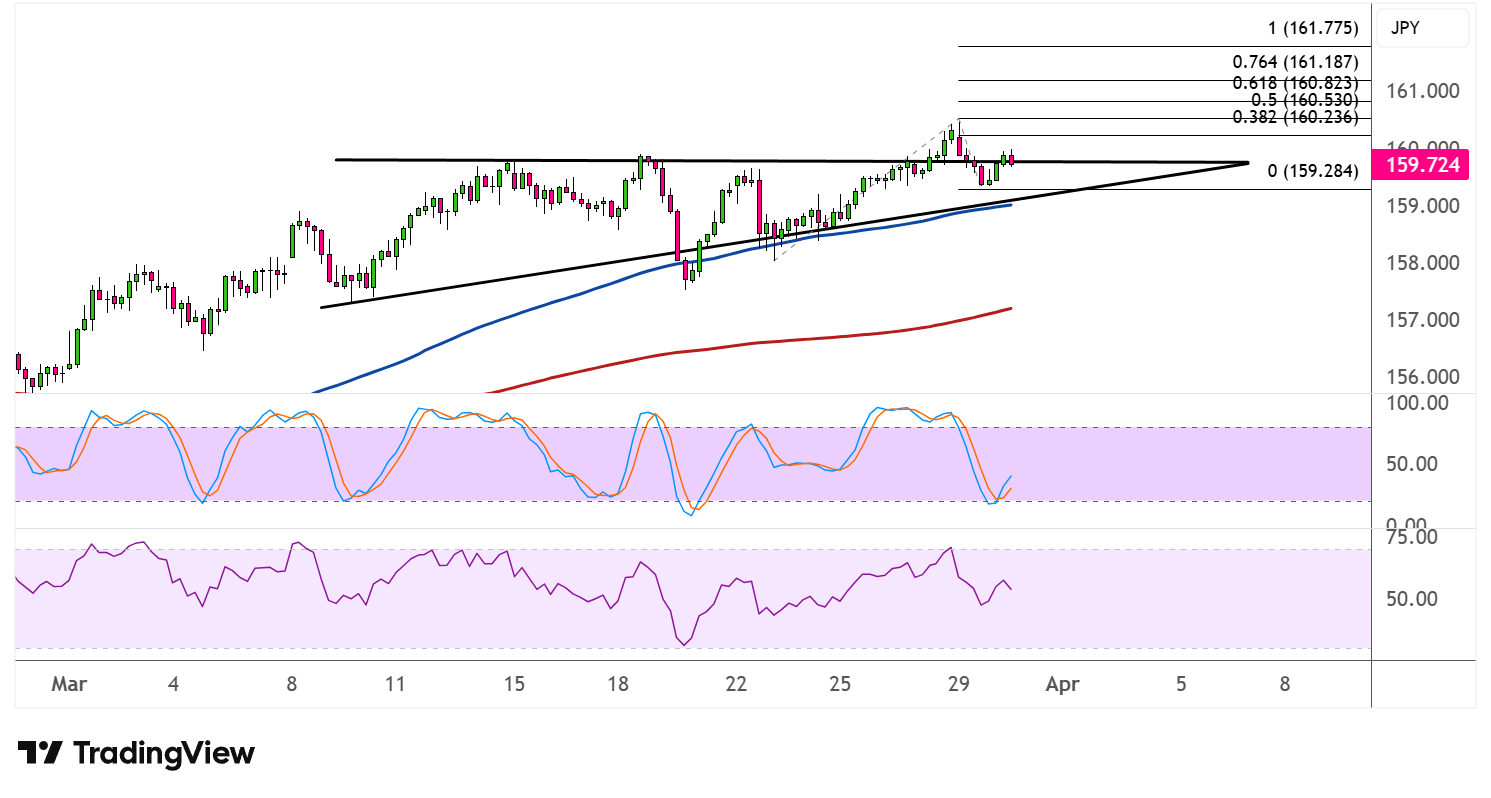
The 100 SMA is above the 200 SMA, confirming that the path of least resistance remains to the upside and that the broader bullish trend is still intact. The gap between the two indicators continues to support the case for further gains.
Stochastic has tumbled sharply from overbought territory and is now approaching the oversold zone, reflecting a buildup of selling pressure during the current pullback. Notably, this mirrors previous instances on the chart where oversold stochastic readings coincided with solid bounce points. RSI has also retreated meaningfully but still retains room to push lower before reaching oversold territory, so the correction could extend slightly before buyers step back in.
A hold above the triangle breakout zone would keep the bulls in the driving seat, with 161.77 firmly in their sights.