
VZ Long-term outlook
Verizon (NYSE: VZ) received downgrade this month Barclays and MoffettNathanson. The downgrade comes as analysts think a merger between Sprint (NYSE: S) and T-Mobile (NASDAQ: TMUS) will end price wars between operators and lead to better market. Both analysts stay optimistic on VZ share prices but think the valuation has reached the cap after several months rally.
We think the future development of 5G is the reason market players decided to proceed with caution as the technology still has an unknown potential for investors. While VZ has more room upside, a major development in share prices might happen after 5G technology become more official.
New Month
Monthly chart

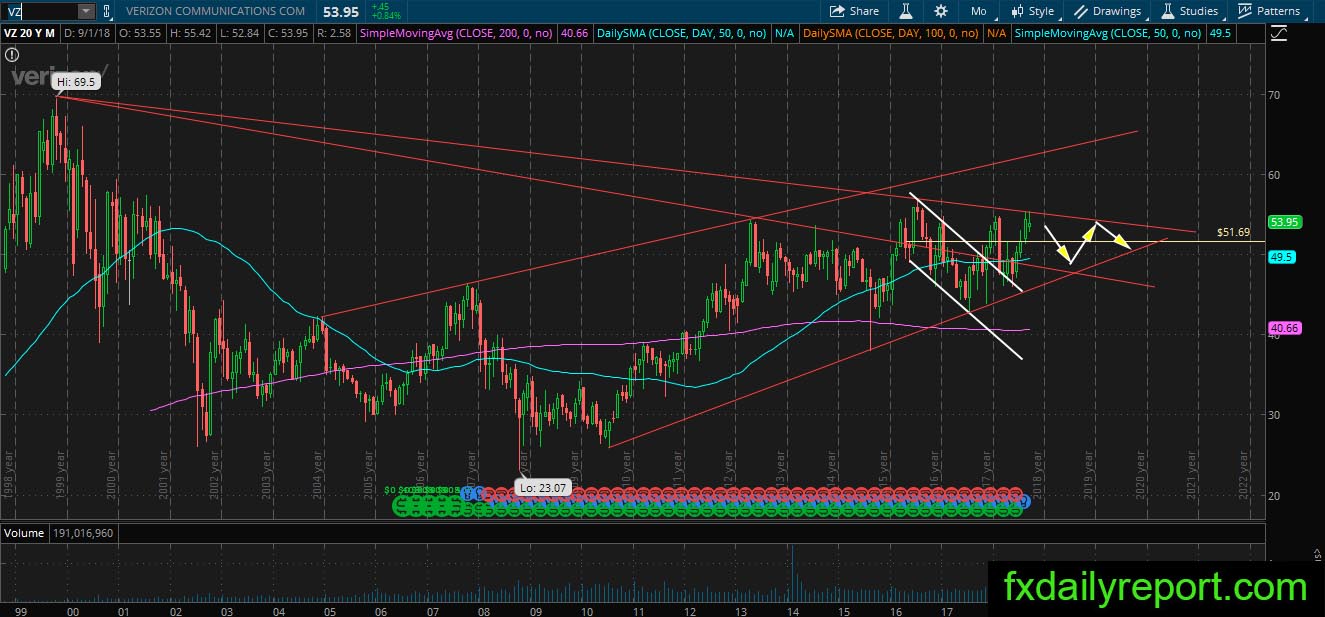
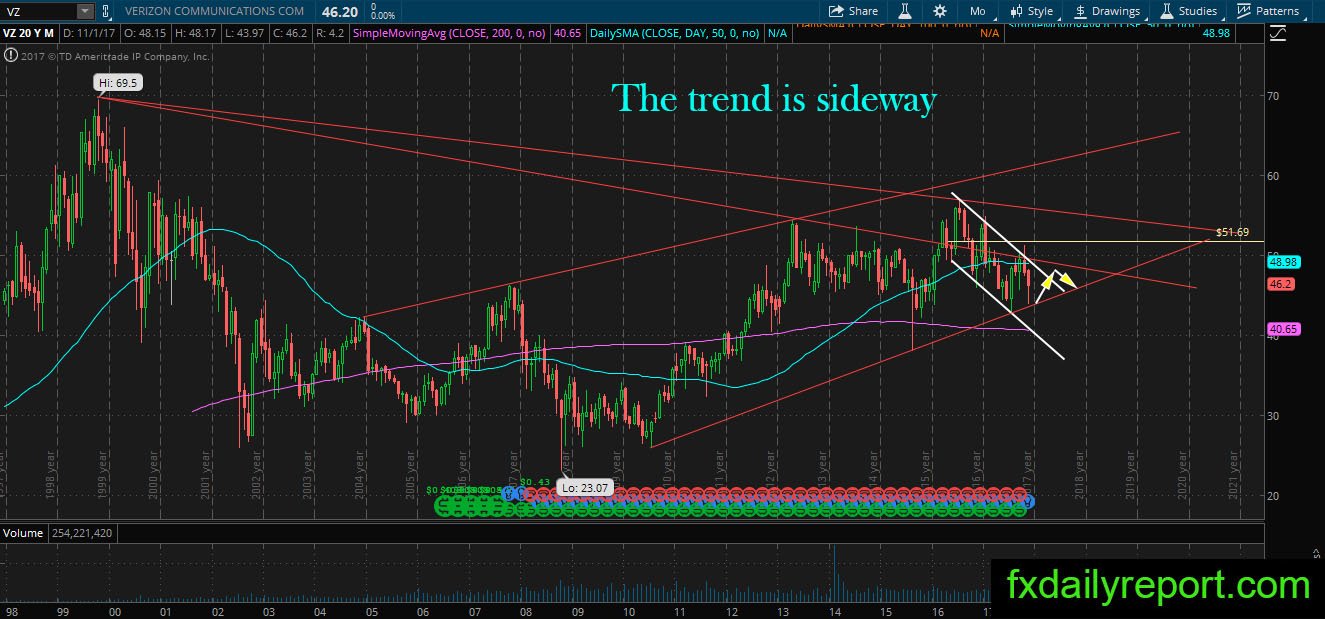
VZ share prices might not have much progress since our previous analysis. The share prices are traded sideways inside the triangle range. The breakout from white channel brought VZ to the top of trendline before it rejected again and retest the white channel. Currently, the share prices hovering near the top of triangle once again. Without any change in the trend, we could expect VZ will experience rejection and start moving down.
Weekly chart
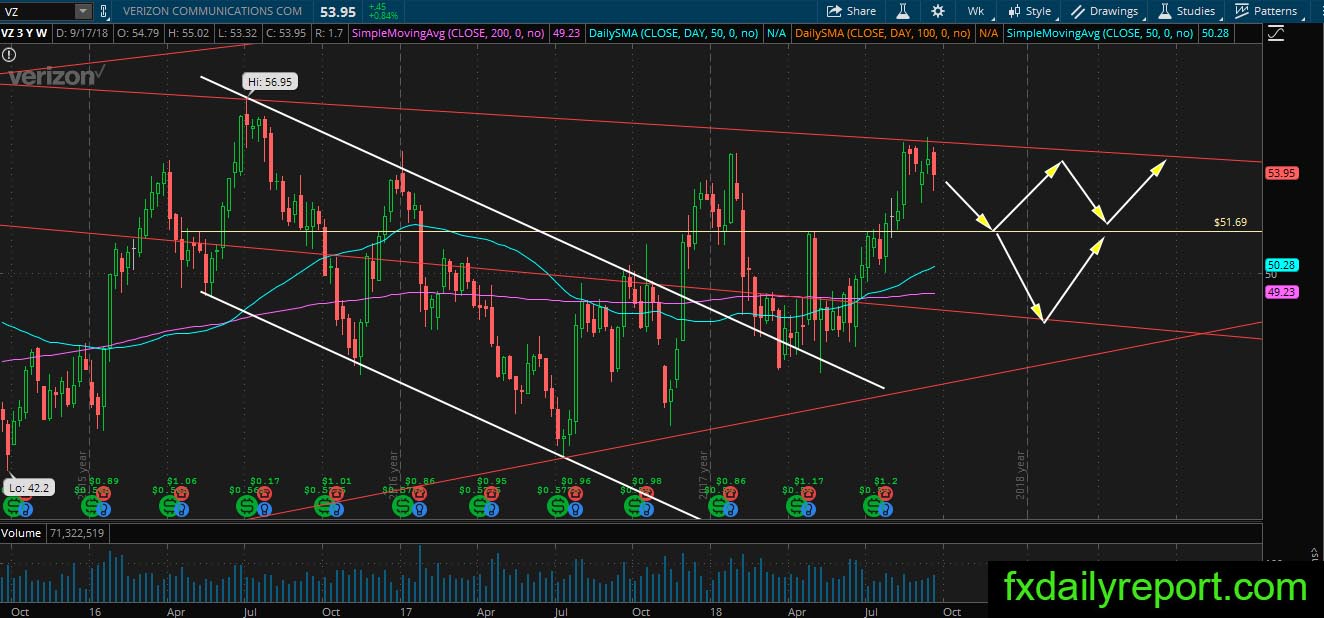
VZ has trouble to surpass the top of the triangle shown on the weekly chart. The share prices show weakness on the latest week and might be ready for a downward correction. If correction happens, $51.69 is the initial target level to watch.
Daily chart

Zooming in the daily chart, VZ almost reaches the daily support around $52.80 or the daily SMA 50. Shorting at the current level is a little bit late but still possible with a stop above $55.42. However, if the share prices manage to hit $51.69 expect some bullish reaction.
Trade plan
Bullish position needs to wait until a test of $51.69 produces a bullish pattern. On the lower part, traders could use the triangle pattern on the VZ chart to place long-term long position.
The bearish position could be taken from the top of the triangle on the monthly chart.