
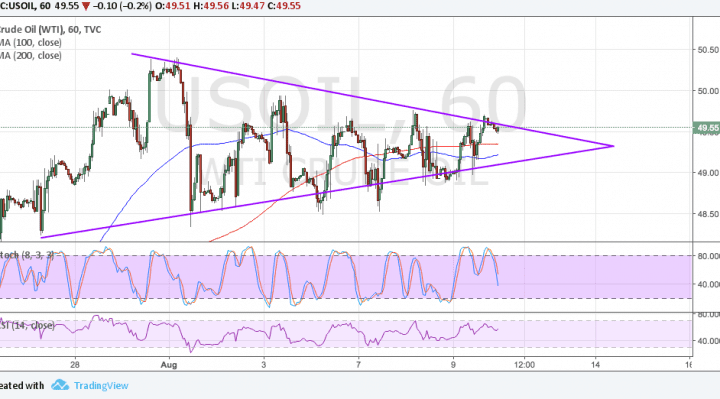
WTI crude oil is still in consolidation mode and seems to be moving in more of a symmetrical triangle pattern than a range as previously indicated. On the 1-hour chart, price has formed lower highs and higher lows. It is currently testing the resistance and could be due for another move down.
The 100 SMA is below the longer-term 200 SMA so the path of least resistance is to the downside. Stochastic is heading down to show that sellers are in control of price action and WTI crude oil could head down as well. Stronger selling pressure could even lead to a break of the triangle support around $49.25 and a drop of around $2.50 or the same height as the chart formation. RSI also looks ready to head down to reflect a pickup in selling pressure.

The Energy Information Administration reported a larger than expected draw of 6.5 million barrels in crude oil stockpiles for the previous week, further easing global glut concerns. Stronger demand in the US is expected as the sanctions on Venezuela’s oil could lead to more inventory usage. Traders are turning their attention to the Baker Hughes oil rig counts next to get a gauge of future supply.
However, risk sentiment appears to be the bigger drivers of crude oil action these days as traders are keeping close tabs on the situation with North Korea. The latest headlines are suggesting that Pyongyang is looking into “simultaneous firing” of missiles on Guam and the US government has also responded that provocation will be met with “fire and fury.”
Escalating tensions could keep investors on edge, which usually means losses for riskier commodities like crude oil. This could lead to a flight to safety to other commodities like gold and silver, as well as lower-yielding currencies like the dollar and the yen.
On the other hand, if tensions subside, crude oil could be poised for more upside once it successfully clears the $50 per barrel barrier.