
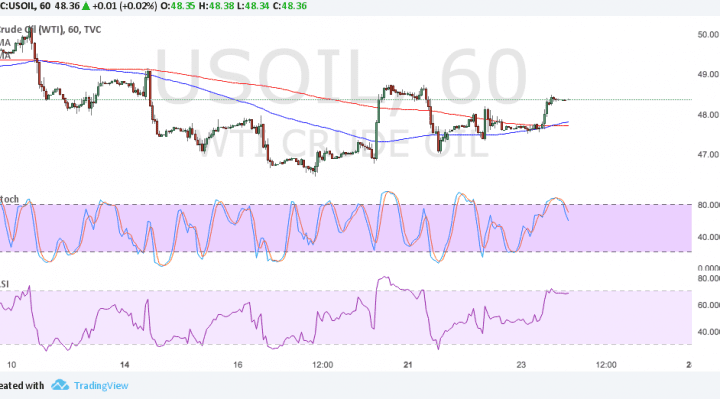
WTI crude oil seems to be done with its slide as it formed a double bottom pattern on its 1-hour time frame. Price has yet to break past the neckline around $49 per barrel before confirming the potential uptrend. The chart pattern is approximately $2 in height so the resulting rally could be of the same size.
The 100 SMA just crossed above the longer-term 200 SMA to indicate that the path of least resistance is to the upside. In other words, the climb is more likely to continue than to reverse. However, stochastic is turning lower to show that selling pressure is returning. RSI has room to head north so bulls could stay in control for much longer, but this oscillator is also nearing overbought levels.

Data from the Energy Information Administration showed that US crude oil stockpiles fell by 3.3 million barrels as expected. This is slower than the earlier reduction but still enough to keep global glut concerns in check since it was the eighth consecutive weekly decline in crude oil stockpiles.
The market will now turn its attention to the Baker Hughes oil rig counts which have also been falling. From there, the API and EIA reports are likely to determine whether or not the crude oil rally could carry on.
The upcoming Jackson Hole Symposium could also have a say in where WTI crude oil is headed next since remarks from officials are likely to have a strong impact on overall market sentiment. Commodities appear to be having trouble sustaining their gains as risk-off vibes stemming from North Korea and political troubles in Washington are keeping a lid on higher-yielding commodities.
The EIA report also showed that distillate stockpiles, which include diesel and heating oil, rose by 28,000 barrels, versus expectations for a 93,000 increase. Overall U.S. crude stocks fell to 463.2 million barrels, a 14% drop from the peak of 535.5 million barrels at the end of March.