
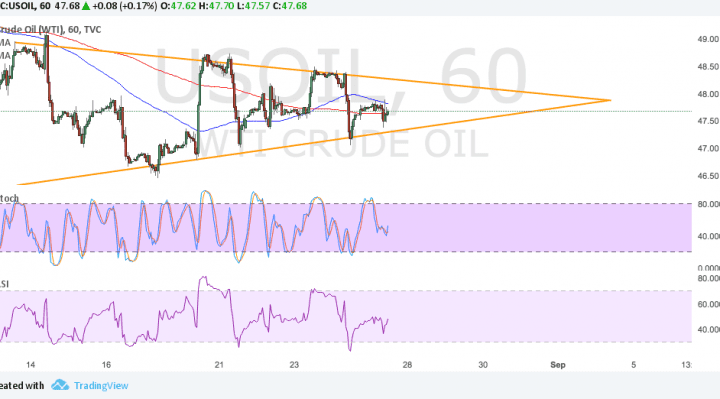
WTI crude oil is back in consolidation mode as it formed higher lows and lower highs, creating a symmetrical triangle pattern visible on its 1-hour time frame. Price is bouncing off support and might be due for a test of the resistance soon.
However, the 100 SMA is above the longer-term 200 SMA to signal that the path of least resistance is to the upside. Then again, the moving averages might simply be oscillating to reflect range-bound conditions.

Stochastic is on the move down to show that sellers are in control of price action, but RSI is turning higher to show that buying pressure is present. If there aren’t much catalysts for a breakout, WTI crude oil could keep trading inside the triangle, bouncing off support and resistance for the meantime.
But if a breakout takes place, price could either climb or fall by around $2 or the same height as the chart formation. Note that WTI crude oil is sitting right at the bottom of an ascending channel visible on its 4-hour chart so a break below this area could signal that a longer-term downtrend is in order.
Crude oil inventory data from both the American Petroleum Institute and the Energy Information Administration have indicated reductions in stockpiles, continuing to keep global glut concerns in check. However, traders are worried that the Hurricane Harvey projected to hit Texas by Friday would lead refineries to ramp up production in anticipation of closures.
With that, next week’s inventory data could include large gains and might revive oversupply issues. As for the OPEC, many are still waiting on the cartel to announce more measures to keep output in check.
The Jackson Hole Symposium might also have an impact on overall market sentiment and therefore commodity prices. A few days back, the return of North Korean threats were enough to dampen demand for higher-yielding assets like WTI crude oil.