
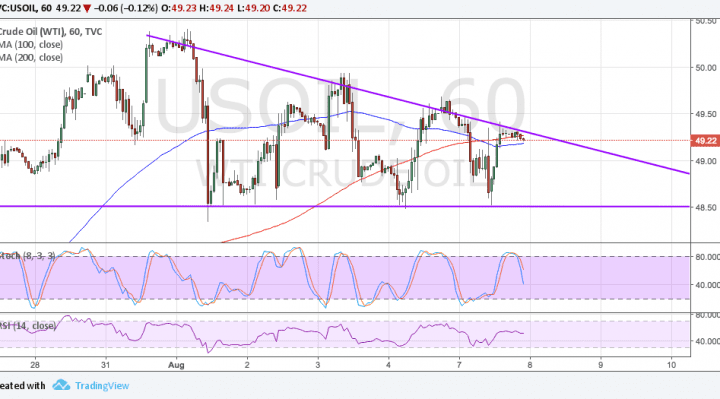
WTI crude oil has formed lower highs and found support around $48.50 per barrel, creating a descending triangle on its 1-hour time frame. Price is testing a major area of interest around $50 per barrel so there’s some degree of hesitation before breaking in either direction.
Price is testing the resistance around $49.25 per barrel at the moment, possibly sending WTI crude oil back to the bottom at $48.50 per barrel. The 100 SMA has crossed below the longer-term 200 SMA on the 1-hour chart to signal a return in bearish momentum. This means that the path of least resistance is to the downside or that the top of the triangle is likely to hold than to break.

Stochastic is also turning down from the overbought level, also reflecting a pickup in bearish pressure. RSI is on the move up, though, so bulls might have a bit of energy left. However, it could also be argued that this oscillator is treading sideways to reflect consolidation conditions.
Last week, the API reported an increase of 1.8 million barrels in crude oil stockpiles while the EIA printed a smaller than expected drop. This has kept crude oil traders on edge about another large build that would revive oversupply concerns.
The OPEC has a meeting going on and traders are also on the lookout for stronger remarks on keeping output levels in check. In the earlier meeting with non-OPEC leaders, Nigeria made an informal pledge to cap exports while Saudi Arabia said that they would press for stronger measures to keep prices afloat.
So far there hasn’t been much word from energy ministers, which explains the current consolidation in WTI crude oil. The chart pattern is around $1.75 tall so the resulting breakout could be of the same size. Keep in mind that the commodity is still within a longer-term descending channel so a break lower could mean more momentum towards the support around $42 per barrel.