
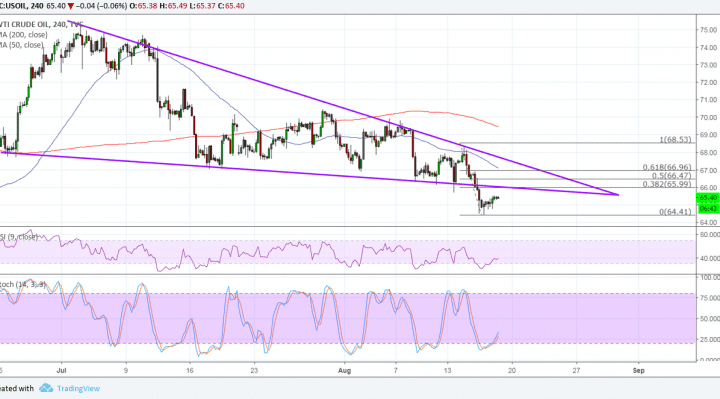
WTI crude oil broke below that falling wedge pattern previously highlighted, signaling that further losses are in the cards. Price seems to be hesitating to head lower, though, so a pullback may take place before it does.
Applying the Fibonacci retracement tool on the latest swing high and low shows that the 38.2% level lines up with the broken wedge support, which might now hold as resistance. The other retracement levels are back inside the wedge and could also keep further gains in check.

The 100 SMA is below the longer-term 200 SMA to confirm that the path of least resistance is to the downside. This suggests that the selloff is more likely to resume than to reverse, and the moving averages might hold as dynamic resistance levels also.
RSI is still heading higher after just making its way out of the oversold region. This signals that buyers could stay in control for a bit longer, until the oscillator hits overbought levels and turns back down. Stochastic is also moving up to show that bullish pressure is present and could take crude oil higher from here.
Earlier in the week, crude oil took huge hits on a surprise buildup in US stockpiles, reviving fears of oversupply in the global markets. Recall that the OPEC noted in its monthly report that global demand is expected to be lower than initially projected, which could leave a glut in production.
Still, the cartel is also working on relaxing compliance to its output deal in an effort to stabilize prices, and it seems that some effects are already in play. The commodity is also taking cues from overall market sentiment, particularly on updates related to trade as these would impact demand for energy.
Next up, the Baker Hughes oil rig counts report could give a sense of whether or not production could stay elevated in the weeks ahead.