
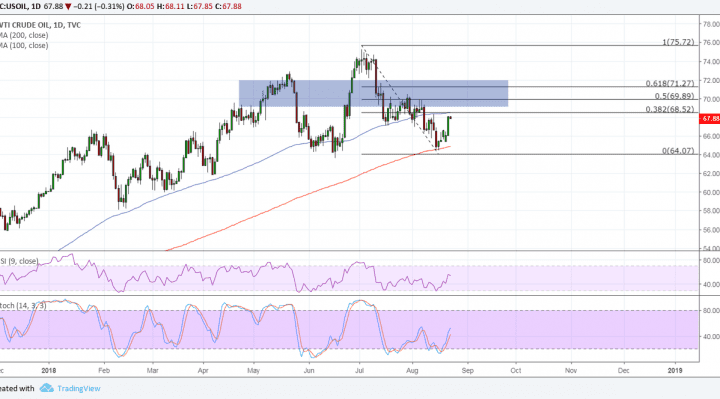
WTI crude oil is popping higher once more but, given how it already broke below a long-term climb, this might just be a mere correction from the earlier slide. Applying the Fibonacci retracement tool on the latest swing high and low shows that the 50% to 61.8% levels span an area of interest where sellers might be waiting.
In particular, the 61.8% level lines up with a former resistance around $72 per barrel. If this keeps gains in check, crude oil could complete the formation of a head and shoulders pattern or a classic reversal signal. The neckline of this would be at $64 per barrel, and it would take a break below this level to confirm a longer-term slide.

The 100 SMA is above the longer-term 200 SMA on this time frame, which means that the path of least resistance is to the upside. In other words, the longer-term uptrend is more likely to resume than to reverse. Then again, the gap between the moving averages is slowly narrowing to reflect weaker bullish momentum.
Stochastic is making its way out of oversold levels, though, so a pickup in bullish pressure may be in order. RSI is also moving up so crude oil could follow suit while buyers regain the upper hand. The 200 SMA is also holding as dynamic support and may be the line in the sand for this rally.
Crude oil got a strong boost after the EIA and API reported larger than expected draws in stockpiles. This follows a week where the Baker Hughes oil rig count was unchanged, putting downside pressure on output.
At the same time, positive sentiment in the midst of trade talks between the US and China has also helped lift commodities. After all, easing tensions could mean less uncertainty for businesses and higher demand for energy products needed in production.