
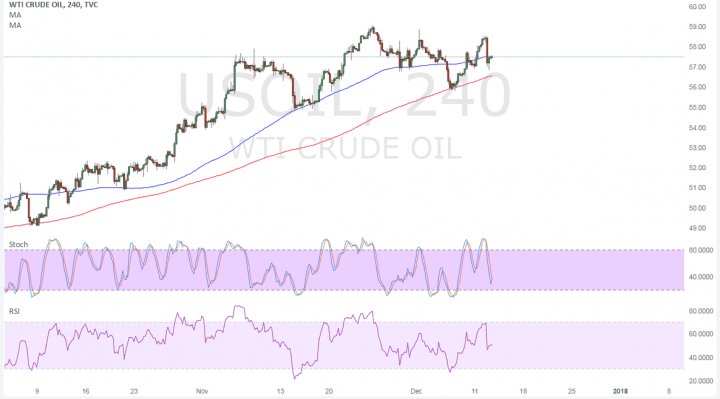
WTI crude oil continues to stumble on its climb, forming what might be a head and shoulders pattern on its 4-hour chart. Price is in the middle of forming its right shoulder and could soon test the neckline around $56 per barrel.
The 100 SMA is still above the longer-term 200 SMA, though, so the path of least resistance is to the upside. However, the gap between the moving averages is narrowing to suggest weakening bullish momentum. If a downward crossover materializes, selling pressure could kick in.

The chart pattern spans $56-59 per barrel so the resulting selloff could be of the same height. Stochastic is on the move down to show that bears have the upper hand while RSI is also heading south to signal that bearish momentum is in play.
Brent crude oil has gained support from another pipeline shutdown but WTI crude oil has failed to join in as US rig counts have ticked higher in the previous week. Still, the American Petroleum Institute reported a huge draw of 7.382 million barrels of United States crude oil inventories for the week ending December 8 versus the estimated reduction of 3.759 million barrels.
The report also showed another build in gasoline inventories, but this time more moderate, at 2.334 million barrels for the week ending December 8, close to estimates at 2.457 million barrels.
The Energy Information Administration is due to report its own inventory data next and might show a draw of 3.6 million barrels, smaller than the earlier reduction. Another potential catalyst for oil is the upcoming FOMC statement, which could set the tone for borrowing conditions and business demand next year.
Trump’s tax announcement could also have a significant counter-effect since a large corporate tax cut before the end of the year would spur business activity and therefore demand for commodities. Risk appetite is expected to tick higher as the House and Senate move closer to a unified tax bill as well.