
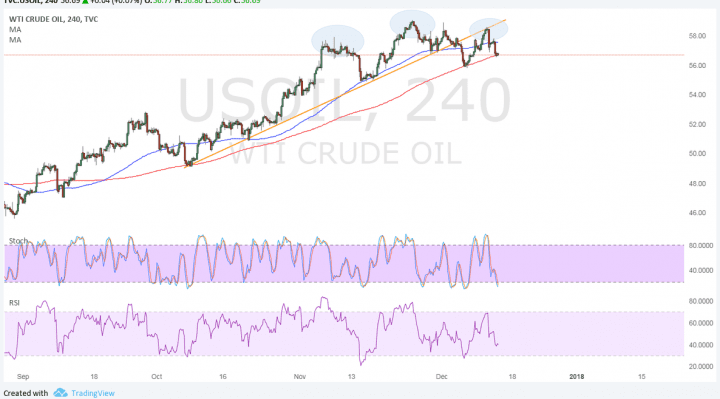
WTI crude oil recently broke below an ascending trend line support on its 4-hour time frame and completed its pullback. Price is now completing its right shoulder of the head and shoulders reversal formation.
The neckline of this chart pattern is located around $56 per barrel and a breakdown would send it lower by around $3 or the same height as the formation. Price is currently drawing support from the 200 SMA dynamic inflection point.

The 100 SMA is above the longer-term 200 SMA to signal that the path of least resistance is to the upside. This means that the uptrend could still resume. However, the gap between the moving averages is narrowing to show that a downward crossover may be imminent.
Stochastic is also heading south, which means that selling pressure is present. RSI is also pointing down so crude oil might follow suit. However, both oscillators are also nearing oversold levels to signal a potential return in bullish pressure later on.
The EIA report showed another larger than expected draw in stockpiles but failed to lift crude oil as much. Brent crude oil is drawing support from another pipeline shutdown but the price action doesn’t appear to have carried over to WTI crude oil.
Traders are now turning their attention to the Baker Hughes oil rig counts report as another gain would keep oversupply concerns in play. The reopening of the Keystone Pipeline also means more supply flowing to the US from Canada, which means a lower chance of depleting local supply.
Looking ahead, the Fed rate hike could also keep a lid on business activity and demand for commodities. Then again, tax cuts could provide a counter effect and balance the markets. Note that the OPEC already agreed to extend their output deal until the end of 2018 but could be due for a review in June.