
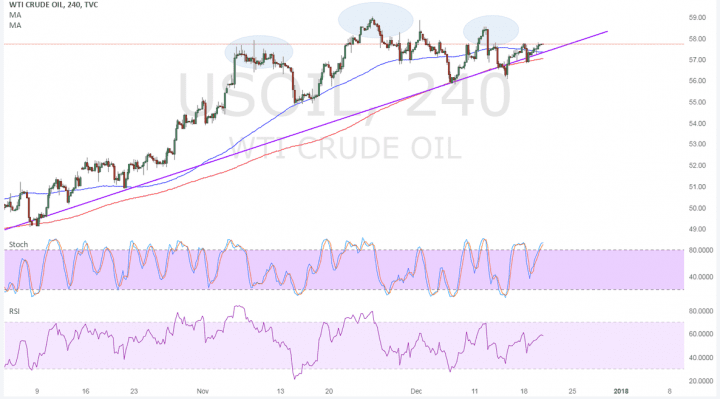
WTI crude oil could be in for a selloff as price can’t seem to gain enough traction for a bounce off the trend line. Price has also formed a head and shoulders pattern on its 4-hour time frame to signal a downtrend.
The commodity price has yet to break below the neckline around $57 per barrel to confirm the selloff. The 100 SMA is still above the longer-term 200 SMA for now to show that the path of least resistance is to the upside, but a downward crossover seems imminent. These moving averages are also in line with the rising trend line to add to its strength as support.

Stochastic is pointing up to show that bullish momentum is present while RSI has some room to climb. However, stochastic is nearing overbought levels to reflect exhaustion among buyers and a potential return in selling momentum. The chart pattern spans around $56 to $59 per barrel, so the resulting breakdown could be followed by a selloff of the same height.
The American Petroleum Institute reported yet another larger than expected draw in crude oil stockpiles but this failed to lead to a big boost in price. The EIA is set to release its numbers later today and a similar result is eyed.
Dollar demand seems to be outweighing crude oil gains for now as traders are paying closer attention to tax reform developments. The House already cleared the final bill but another vote needs to be held as the proposal actually contained differences with what the Senate approved.
Nonetheless, tax cuts could clear the way for stronger business investment and activity down the line, which would likely prop up demand for commodities. This should help curb the pickup in production in the US, likely keeping prices supported.
For now, it looks like commodity traders are taking it easy until the end of the year and might book more profits off the recent climb in the days ahead.