
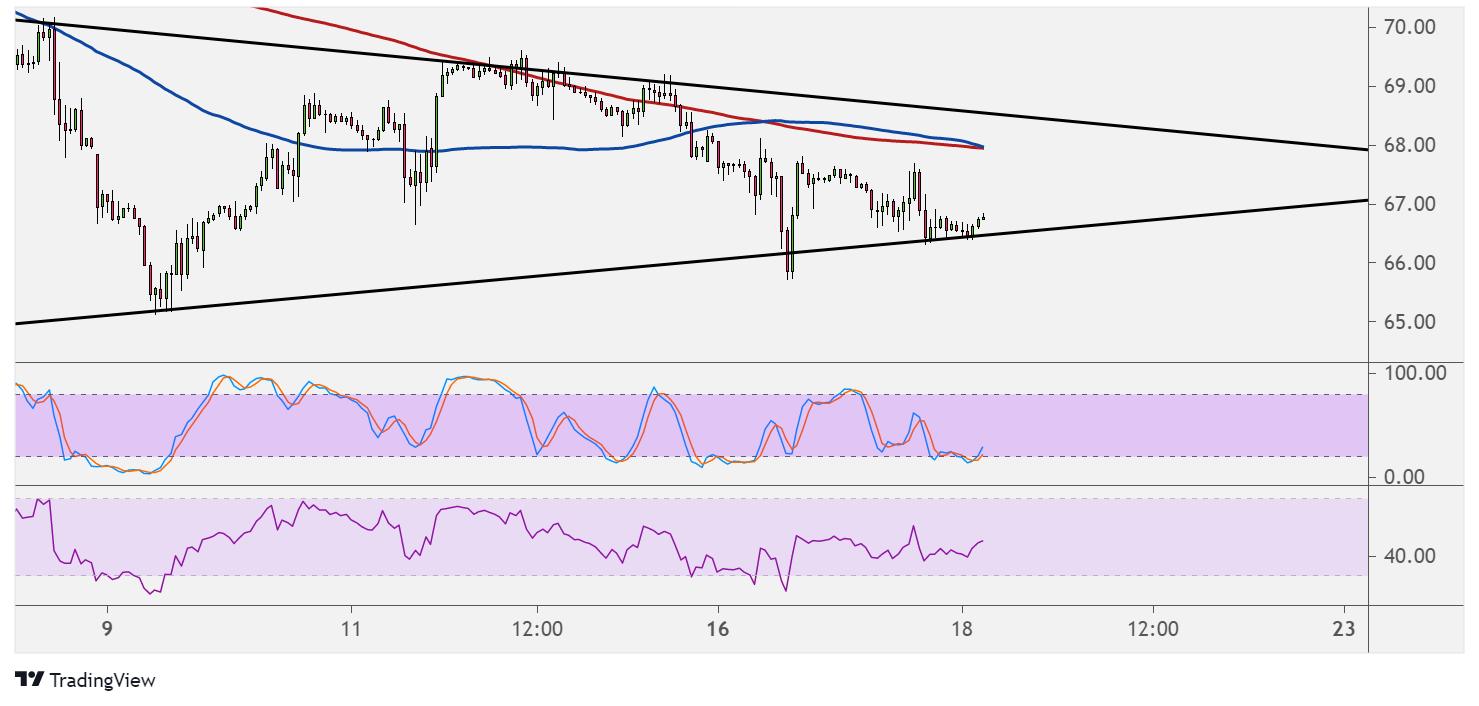
WTI crude oil is consolidating, forming higher lows and lower highs inside a symmetrical triangle pattern on its short-term chart. Price is currently testing the triangle support.
A bounce off this area could set off another move to the top around $68 per barrel. A break lower, on the other hand, could be followed by a selloff that’s the same height as the chart pattern. The triangle spans around $65 per barrel to $70 per barrel.

The 100 SMA appears to be attempting a bearish crossover from the 200 SMA to signal that sellers are taking over. However, stochastic is turning higher from the oversold region to indicate that bullish momentum might return while sellers take a break.
RSI is on the move up, also confirming that buyers are in control at the moment. The oscillator has some room to climb before reflecting oversold conditions.
Crude oil is tossing and turning mostly due to geopolitical risks and overall market sentiment. For one, the tensions in the Middle East might once again lead to crippled supply, but the lockdowns imposed to curb the spread of the virus might limit demand.
Also note that the OPEC has agreed to increase production by 400K barrels per day starting this month until the end of the year, keeping global supply elevated.
The upcoming EIA inventory report might determine whether or not the triangle support is likely to hold. Analysts expect a draw of 1.5 million barrels, larger than the earlier reduction of 0.4 million barrels, reflecting sustained demand.
A surprise build, however, could signal that purchases have turned lower, likely weighing on the commodity price. A larger than expected draw might indicate that fuel and energy commodities are enjoying a strong rebound, leading to even more gains for crude oil prices.