
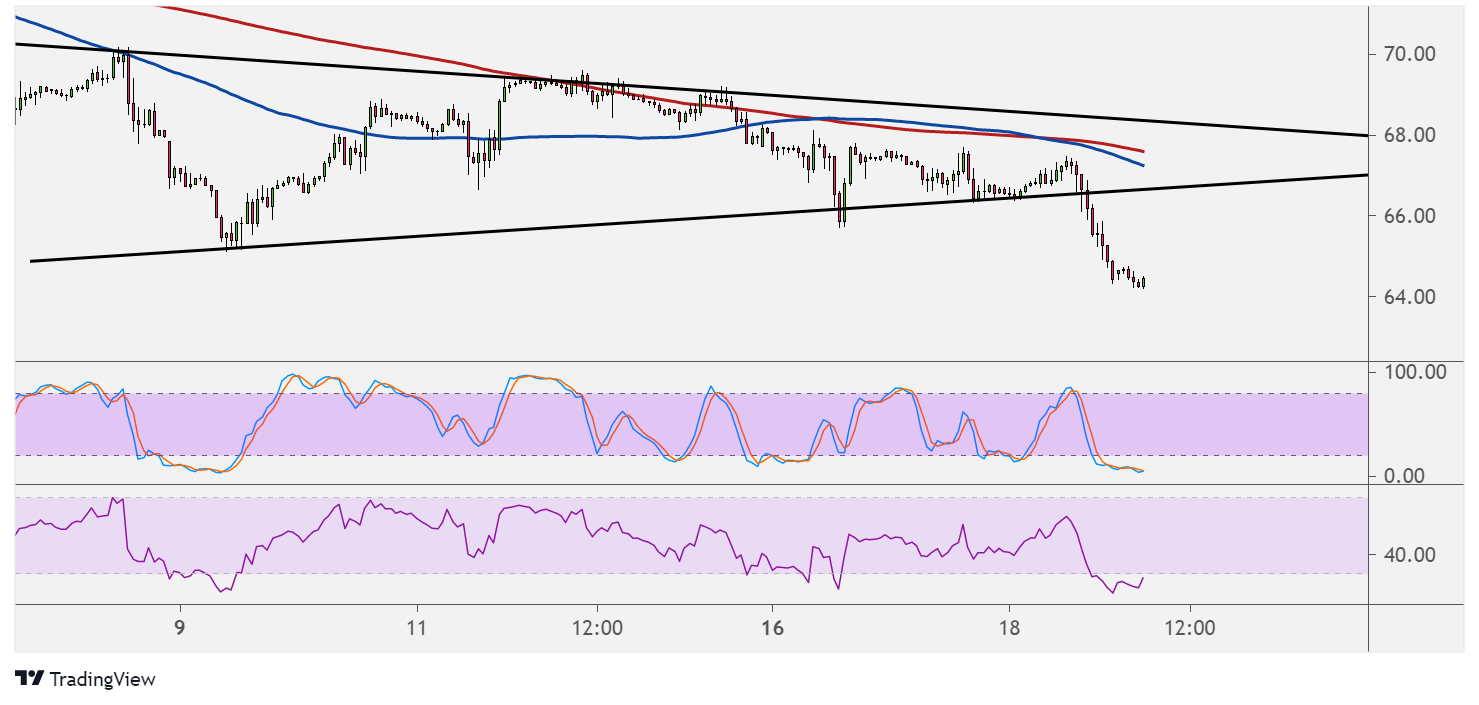
WTI crude oil broke below the bottom of its symmetrical triangle, confirming that a selloff is in order. However, technical indicators are giving mixed signals.
The 100 SMA is below the 200 SMA to confirm that the path of least resistance is to the downside or that the drop is likely to gain traction. The chart pattern spans around $5 so the resulting drop could be of the same height.

However, stochastic is already indicating oversold conditions or exhaustion among sellers. Turning back up would mean that buyers are returning. RSI is already starting to bottom out to suggest a pickup in bullish pressure.
This might merely lead to a pullback to the broken triangle bottom near $66 per barrel, which might be enough to keep gains in check. If so, crude oil could resume its downtrend.
Price is also trading below both moving averages, so these might hold as dynamic resistance on a much larger correction.
The EIA reported a larger than expected draw in stockpiles of 3.2 million barrels versus the estimated drop of 1.5 million barrels and the earlier reduction of 0.4 million barrels. This confirms that demand remains supported, despite concerns about the Delta variant spread and the increase in global supply from the OPEC deal.
Recall that the cartel agreed to increase production by 400K barrels per day from August to December this year, keeping global glut concerns in play. Lockdowns in some nations like Australia and New Zealand might also bring about a drop in fuel and energy commodity demand, but it looks like the reopening of other economies are making up for this.
Still, risk aversion has stemmed from the FOMC minutes’ hints that tapering could be done before the end of the year. This has led to a bleaker outlook for businesses and consumers, weighing on crude oil prices.