
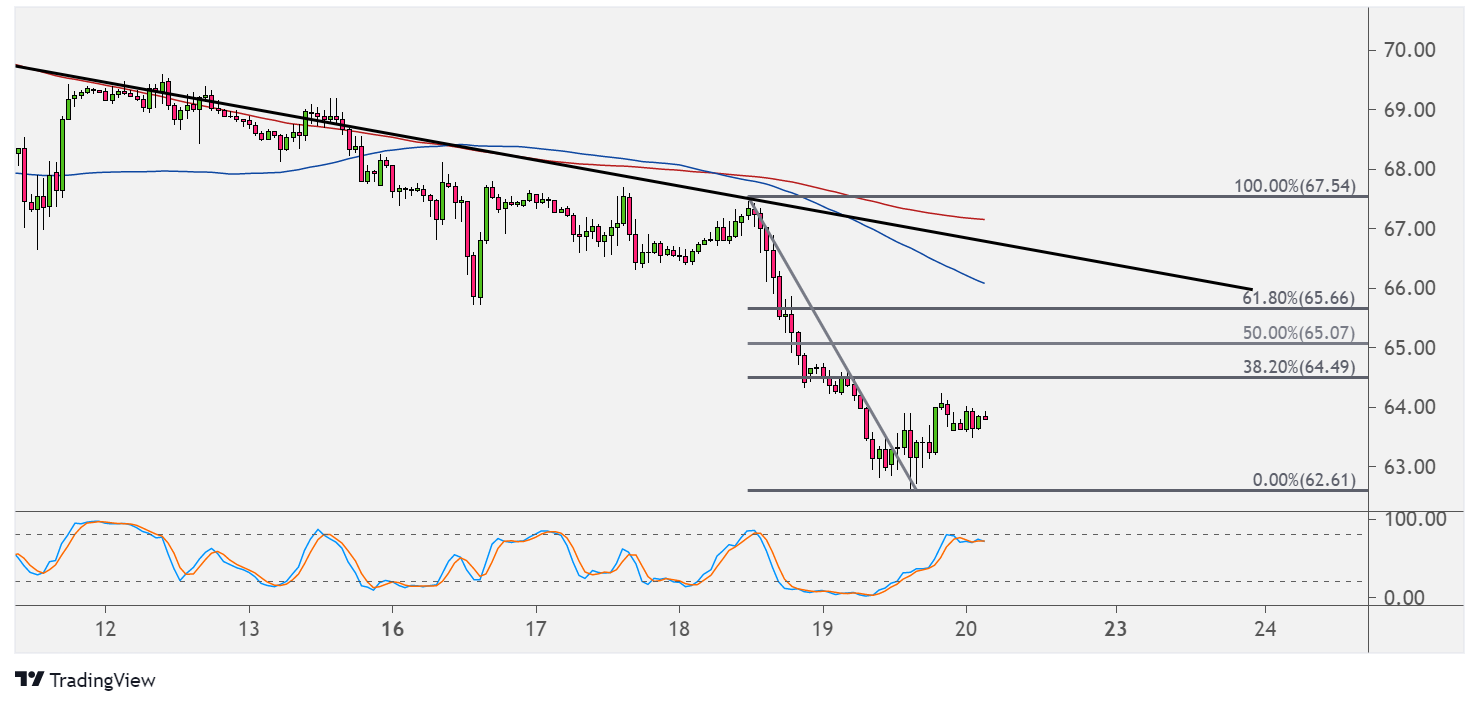
WTI crude oil continues to trend lower but appears to be ready for a pullback from its latest slide. The Fibonacci retracement tool shows where more sellers might be waiting.
The 38.2% level is close by at $64.50 per barrel then the 50% level is at $65 per barrel. A larger pullback could reach the 61.8% Fib that lines up with a former support zone and is near the 100 SMA dynamic inflection point.

On the subject of moving averages, the 100 SMA is below the 200 SMA to confirm that the path of least resistance is to the downside or that the selloff is more likely to gain traction than to reverse. The gap between the moving averages is widening to indicate strengthening selling pressure.
The 200 SMA lines up with a falling trend line connecting the recent highs, and this may be the line in the sand for a correction.
Stochastic has some room to climb before reaching the overbought region, but the oscillator already seems to be topping out to reflect exhaustion among buyers. Turning lower would confirm that sellers are taking over and could push crude oil back to the swing low at $62.60 per barrel or lower.
Crude oil is tumbling on account of risk-off flows brought forth by the prospect of easing Fed stimulus and geopolitical risks. The commodity already shook off its gains from the larger than expected draw reported by the EIA.
Note that the OPEC has agreed to increase production from this month until December, keeping global supply elevated. Meanwhile, lockdowns being announced and extended in several parts of the world could keep demand for fuel and energy commodities in check.
Tensions in the Middle East are also keeping traders wary, leading to stronger demand for safe-haven holdings like the US dollar and weaker purchases of riskier assets like commodities.