
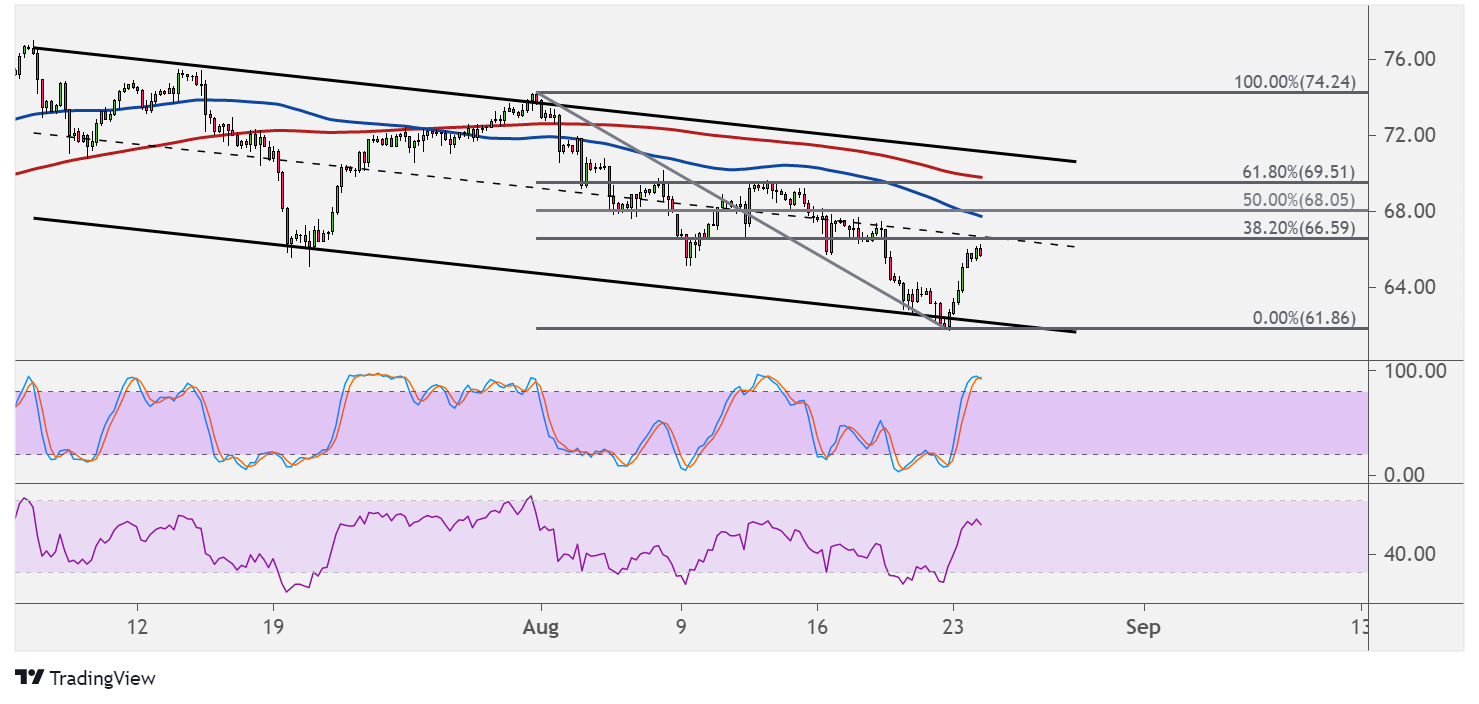
WTI crude oil formed lower highs and lower lows inside a falling channel on its 4-hour chart. Price is bouncing off support and looks due for a correction to the nearby resistance levels.
The Fibonacci retracement tool shows where sellers might be waiting. The 38.2% level lines up with the mid-channel area of interest at $66.59 per barrel while the 50% Fib coincides with the 100 SMA dynamic inflection point.

A larger pullback could reach the 61.8% level at $69.51 per barrel and the 200 SMA dynamic resistance or the top of the channel closer to $70 per barrel.
The 100 SMA is below the 200 SMA to confirm that the path of least resistance is to the downside or that resistance levels are more likely to hold than to break. In that case, crude oil could resume the slide back to the swing low at $61.86 per barrel or the channel bottom.
Stochastic is already indicating overbought conditions to show that buyers could use a break soon and let sellers take over. RSI has more room to climb, though, so price could follow suit and keep the correction going until overbought conditions are met.
The gap between the moving averages is widening to reflect strengthening bearish pressure as well.
WTI crude oil might take cues from the upcoming inventory reports from the API and EIA, as these would depict supply and demand conditions. A draw in stockpiles would suggest that purchases remain supported despite the lockdown measures in some nations like Australia and New Zealand.
On the other hand, a large build in inventories would signal that demand is taking a hit or that supply is elevated. Keep in mind that the OPEC agreed to increase output by 400K barrels per day from August to December since prices already stabilized.