
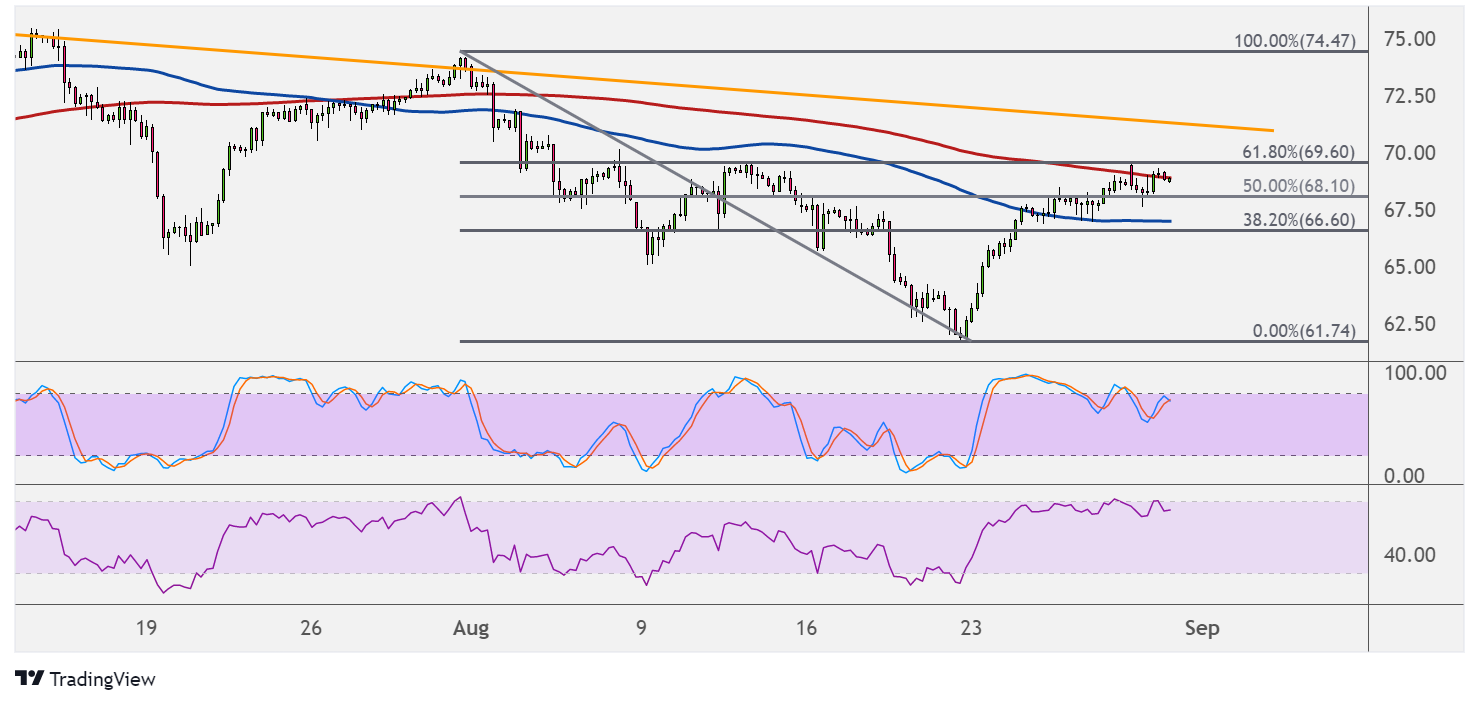
WTI crude oil is still advancing but seems to be hitting a roadblock a the 61.8% Fib. This is near a falling trend line visible on the 4-hour chart and the $70 per barrel psychological mark.
If this holds as resistance, crude oil could resume the slide to the swing low at $61.74 per barrel or lower. A break past this level, on the other hand, could mean a reversal from the downtrend.

Technical indicators are suggesting that the selloff could carry on, though. The 100 SMA is below the 200 SMA to signal that the path of least resistance is to the downside, and the latter is holding as dynamic resistance.
Stochastic is already heading lower after spending some time in the overbought zone, also confirming that bearish pressure is in play. A bearish divergence can also be observed, as stochastic made lower highs while price had higher highs.
RSI is still heading up but appears to be topping out as it nears the overbought area. Turning lower would confirm that a continuation of the drop is due.
Crude oil got a boost from expectations of production disruptions due to Hurricane Ida hitting the Gulf Coast and refineries in other areas. This could mean that another draw in inventories is to be expected in the coming weeks, especially if demand stays supported.
The upcoming inventory figures from the API and EIA would likely determine whether or not the near-term resistance might hold. Aside from that, the outcome of the OPEC-JMMC meetings could also determine the trend for crude oil prices, as any recommendation to adjust the output deal could set global supply expectations.
On the other hand, the lack of any adjustments might keep supply glut concerns in play, possibly keeping a lid on crude oil price gains.