
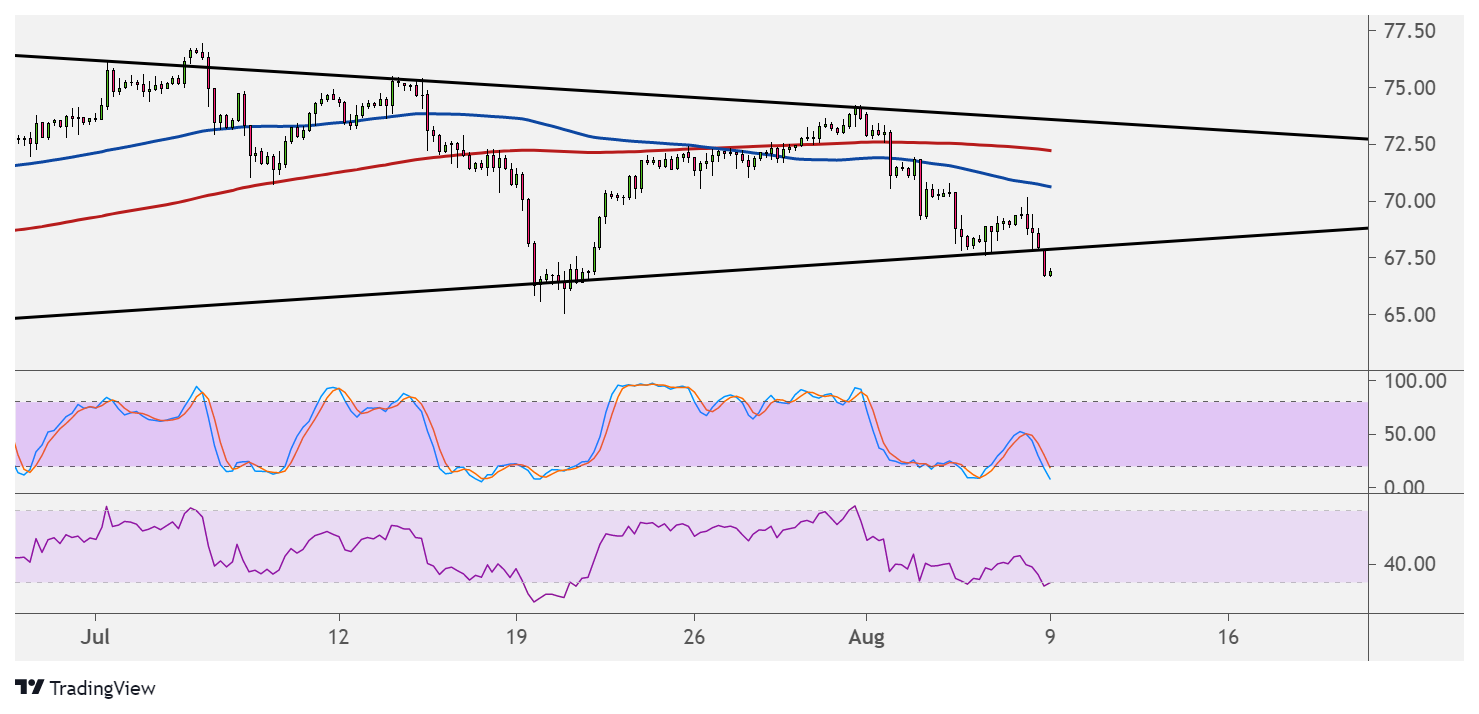
WTI crude oil is breaking below the support of its symmetrical triangle on the 1-hour time frame, indicating that a longer-term drop might follow.
The chart pattern spans around $67.50 per barrel to $75 per barrel, so the resulting selloff could be of the same height. Technical indicators confirm the presence of selling pressure.

For one, the 100 SMA is below the 200 SMA to confirm that the path of least resistance is to the downside or that the selloff is likely to gain traction. Price is also trading below both moving averages as an additional indicator of selling pressure.
Stochastic is pointing down to show that bearish momentum is present, but the oscillator is dipping into the oversold region to reflect exhaustion. RSI is also in the oversold area, suggesting that sellers might need to take a break and let buyers take over.
A strong pickup in buying pressure could take crude oil back to the triangle top at $72.50 per barrel or the dynamic resistance at the moving averages.
Crude oil might take cues from the OPEC-JMMC meetings this week, as the technical committee might revisit the agreement to increase output by 400K barrels per day from this month until December. Concerns about the Delta variant and some lockdown measures in several economies could prompt the cartel to review their demand forecasts.
The upcoming inventory figures from the API and EIA would likely impact crude oil price action during the week as well. A large build in stockpiles would confirm that purchases have slowed on account of weaker business and consumer activity. On the other hand, another draw could suggest that demand remains supported.
Major swings in market sentiment might also account for commodity price swings, especially since the latest NFP report revived Fed tapering hopes.