
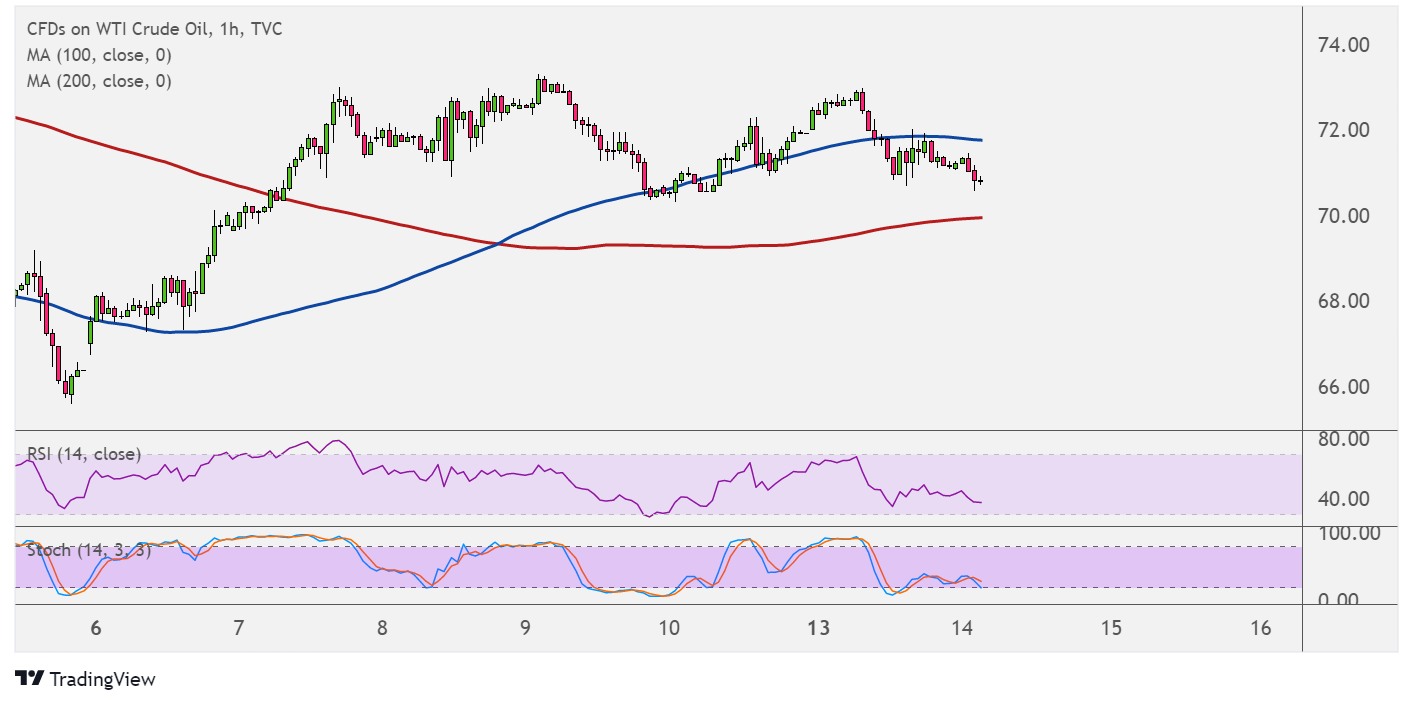
WTI crude oil could be in for a reversal from its short-term climb, as price is forming a double top pattern on its hourly time frame. Price has yet to break the neckline around $71 per barrel to confirm that a downtrend is underway.
If that happens, crude oil could fall by the same height as the chart formation, which spans around $71 to $73 per barrel. However, the 100 SMA is still above the 200 SMA to indicate that the path of least resistance is to the upside or that support is more likely to hold than to break.

Price has fallen below the 100 SMA dynamic support, though, so selling pressure is building up. Crude oil could test the 200 SMA dynamic inflection point next.
RSI is still heading down to show that sellers have some energy left before seeing oversold conditions. Stochastic already seems to be pulling up from the oversold area to reflect a return in bullish pressure. If support holds, crude could could recover to the recent highs or higher.
The upcoming release of inventory data from the American Petroleum Institute and Energy Information Administration could boost crude oil volatility midweek, as a large draw in supplies would signal stronger demand.
However, it’s also important to note that the Omicron variant may have led some businesses to scale back purchases in the past week, possibly leading to a build in stockpiles. The other week saw a small draw of 0.2 million barrels in inventories.
The FOMC decision would likely impact overall market sentiment as well, especially since the central bank is due to print its economic forecasts and dot plot projection of interest rates. A return in risk-taking could be bullish for higher-yielding assets like commodities, including crude oil, while a pickup in risk-off flows could mean more downside.