
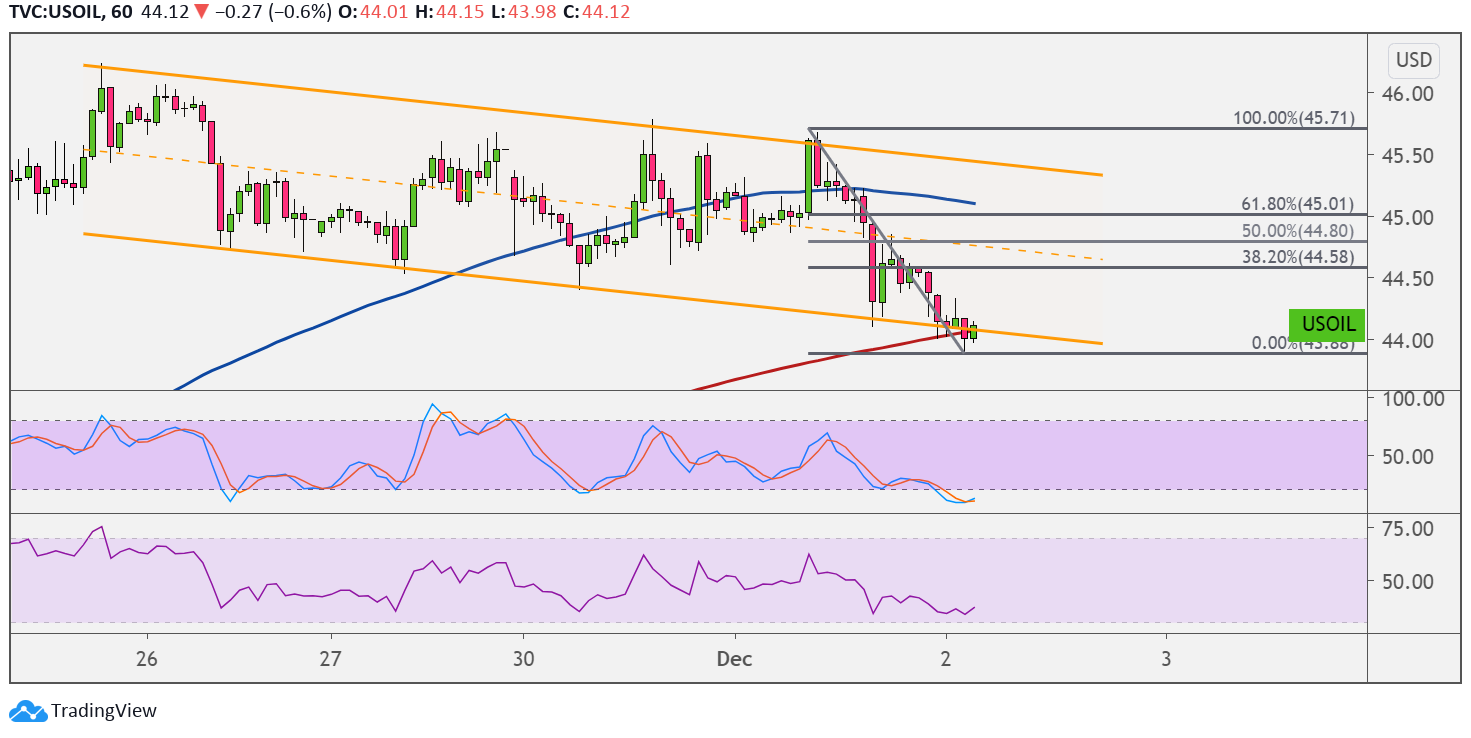
WTI crude oil has formed lower highs and lower lows to trade inside a falling channel on the 1-hour chart. Price is testing the channel bottom and could be due for a bounce to nearby resistance levels.
The Fibonacci retracement tool shows where more sellers might be waiting. The 38.2% level is near the mid-channel area of interest at $44.58 per barrel while the 50% level is at $44.80 per barrel. A larger pullback could reach the 61.8% Fib at $45 per barrel near the 100 SMA dynamic inflection point.

On the subject of moving averages, the 100 SMA is above the 200 SMA to indicate that the path of least resistance is to the upside. In other words, support is more likely to hold than to break, especially since the 200 SMA lines up with the bottom of the channel.
Stochastic is indicating overbought conditions or exhaustion among buyers. Turning higher could mean a return in bullish pressure that could be enough to keep the correction in play. RSI is also hovering around oversold levels to signal that buyers are taking a break.
Crude oil returned some of its recent gains as OPEC+ leaders couldn’t seem to reach an agreement on an output deal. Curbing supply could allow price to go for more gains while the lack of an agreement might leave member nations pumping out as much of the commodity as they can.
Still, risk-on flows could prove bullish for crude oil as traders focus on the possibility of a COVID-19 vaccine being distributed soon. This could mean a return to normal business conditions that could improve optimism and spur demand for fuel and energy.
The upcoming inventory report could bring about short-term volatility as a build in stockpiles could trigger more losses while a reduction could spur a bounce.