
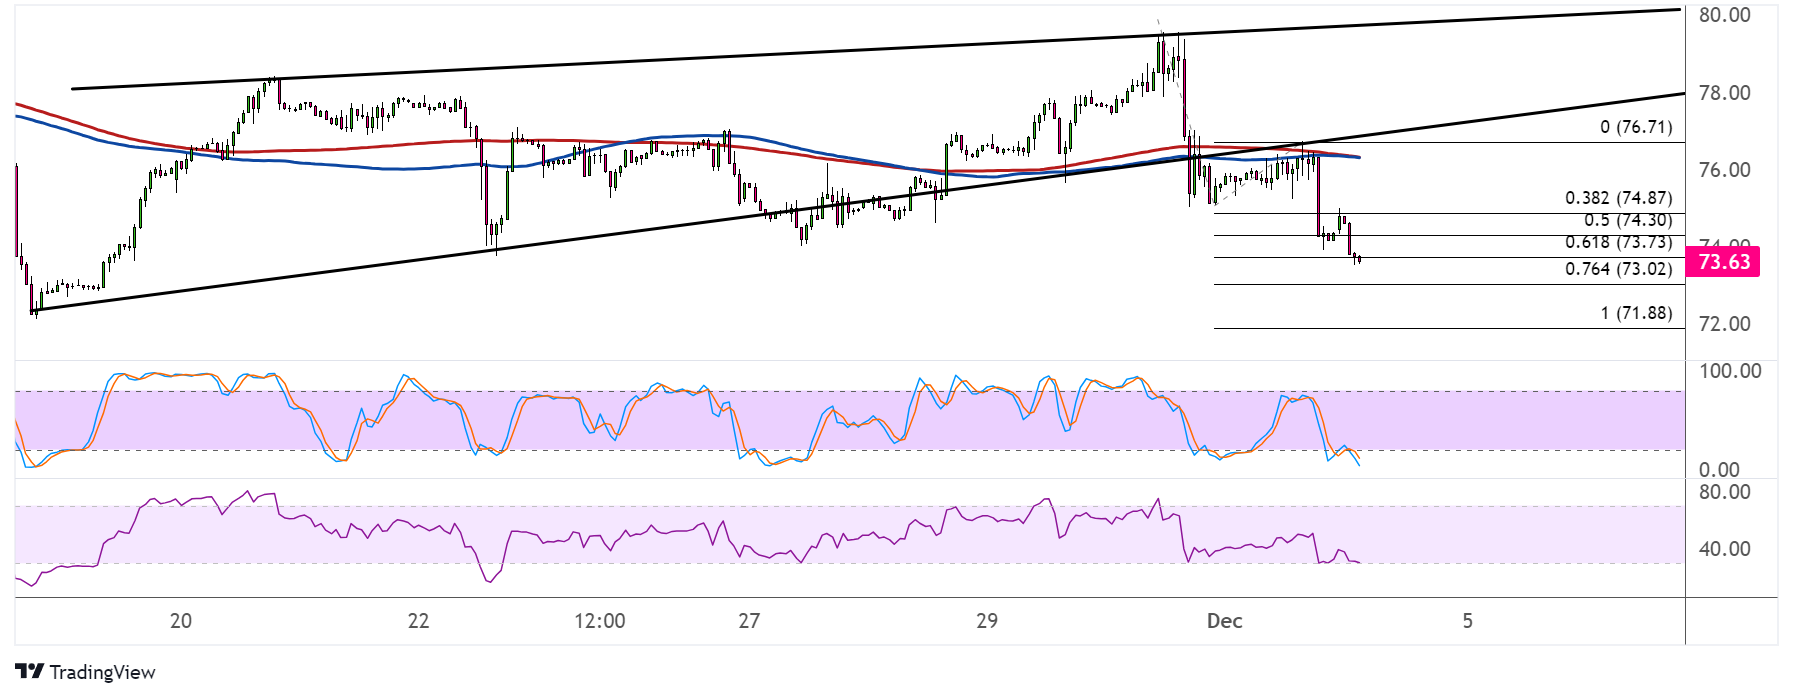
WTI crude oil has formed higher lows and slightly higher highs inside a short-term wedge pattern, but price has already broken below support. This suggests that a selloff of the same height as the formation is due.
The Fibonacci extension tool shows additional downside targets that sellers could be aiming for. Price is now down to the 61.8% extension around $73.75 per barrel but still looks ready for more declines. The 76.4% extension is at $73 per barrel, then the full extension is at $71.88 per barrel.

Technical indicators are looking mixed. The 100 SMA is below the 200 SMA to indicate that the path of least resistance is to the downside, and crude oil is trading below both indicators, so these could keep holding as dynamic resistance levels.
Stochastic is pointing down to show that selling pressure is present, but the oscillator is also dipping into the oversold region to signal exhaustion. RSI is also nearing oversold levels, so turning higher would mean a return in bullish momentum.
WTI crude oil might take cues from inventory data by the American Petroleum Institute and Energy Information Administration. A build in stockpiles might highlight weak demand conditions, possibly translating to losses for the commodity. On the other hand, a draw would suggest that consumption is elevated, easing recession fears and leading to gains for crude oil.
However, the main market mover for the week might be the US NFP release, as an increase in hiring could keep traders hopeful for more rate hikes from the Fed. In turn, this could translate to gains for the dollar and a pickup in risk aversion, which might then boost safe-haven flows.
On the other hand, weak jobs data could ramp up expectations for easing from the Fed by next year, which could mean upside for commodities.