
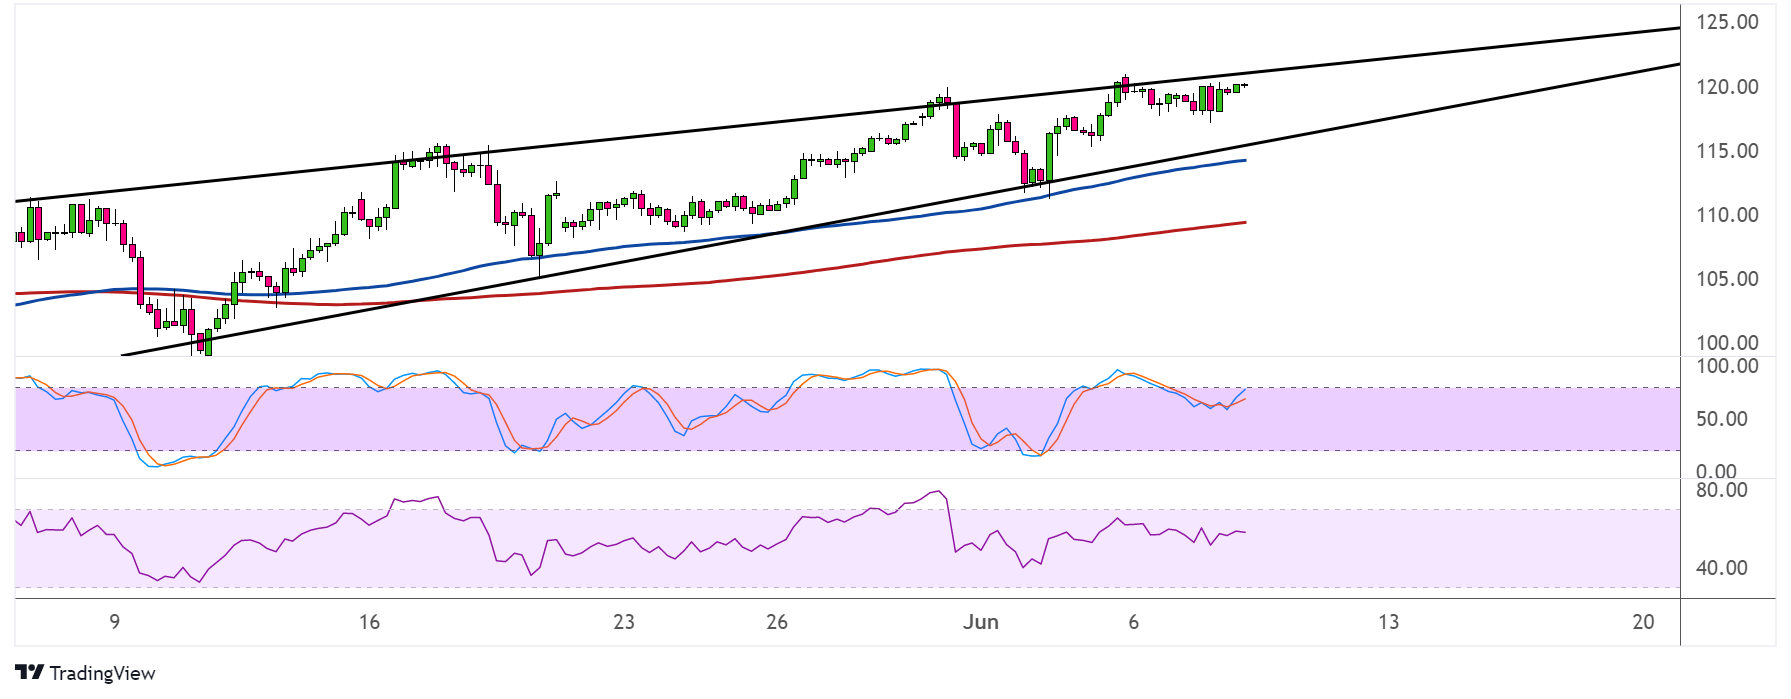
WTI crude oil has formed higher lows and slightly higher highs, creating a rising wedge pattern on its 4-hour time frame. Price is currently testing resistance, and technical indicators are giving mixed signals.
The 100 SMA is above the 200 SMA to suggest that the path of least resistance is to the upside or that there’s a chance the resistance could break. If that happens, crude oil might be in for a rally that’s the same height as the chart pattern.

The gap between the moving averages is also widening to reflect strengthening bullish momentum. In addition, the 100 SMA lines up with the wedge support around $115-120 per barrel to add to its strength as a floor.
Stochastic is heading lower from the overbought zone to indicate that selling pressure is building up. The oscillator has plenty of room to slide before reflecting oversold conditions, so bearish momentum could stay in play for a bit longer. A break below the wedge support could set off a slide that’s the same size as the formation.
RSI is moving sideways but is hovering close to the overbought region to reflect some exhaustion among buyers as well.
Crude oil could take cues from the EIA inventories report, as it could show another draw in stockpiles. A reduction of 2.6 million barrels is eyed, lower than the previous 5.1 million draw. A larger than expected reduction could confirm elevated demand, which might then bring more gains for the commodity.
On the other hand, a surprise build could signal that production is keeping up, likely driving oil prices lower. The American Petroleum Institute reported a soft increase of 1.85 million barrels, so similar results might be reported by the EIA.
Also note that the OPEC has raised production targets last week, adding to downside pressure on the commodity price.