
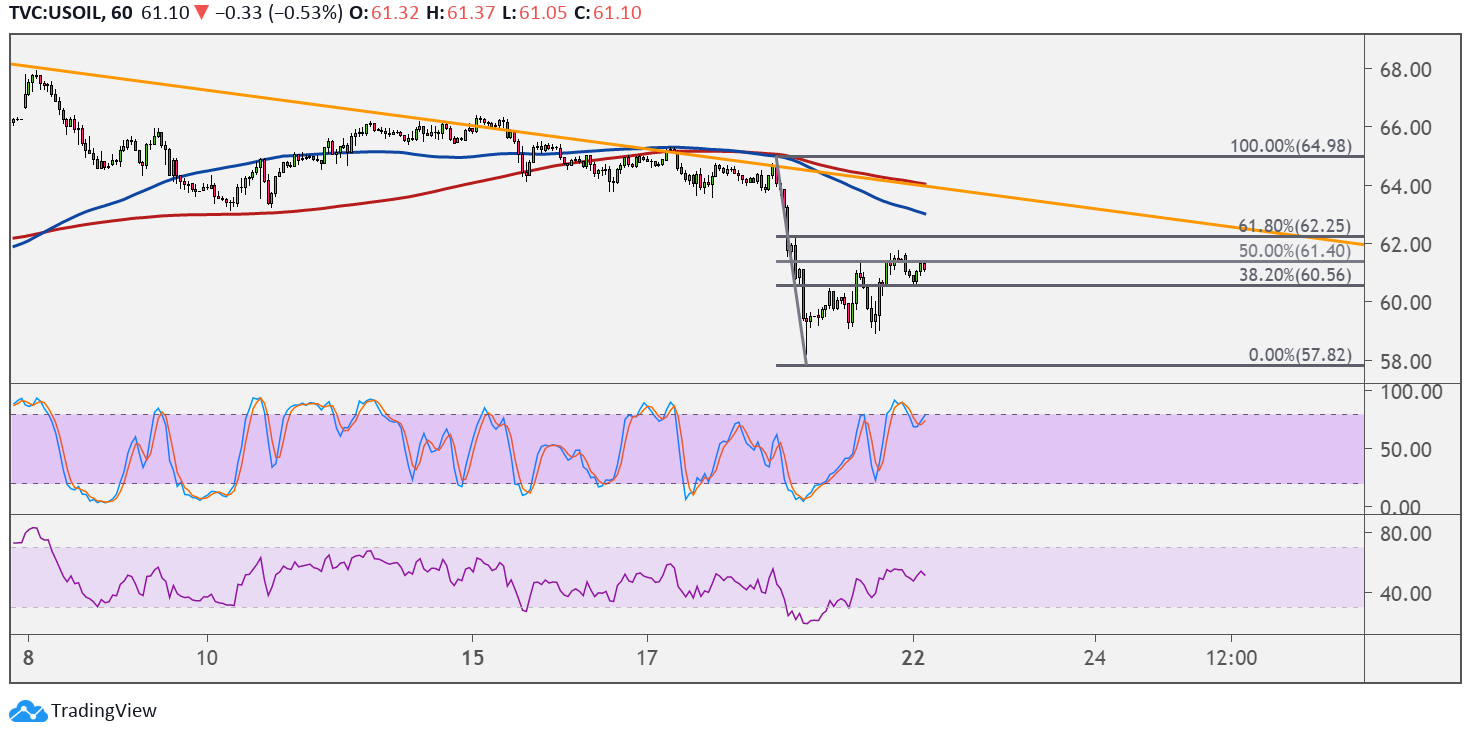
WTI crude oil is still in correction mode as price has advanced to the 50% Fibonacci retracement level. A larger pullback could reach the 61.8% Fib or the descending trend line resistance visible on the 1-hour chart.
The 100 SMA is below the 200 SMA to indicate that the path of least resistance is to the downside or that the selloff is likely to resume. The gap between the indicators is widening to confirm that bearish momentum is strengthening.

The 200 SMA dynamic resistance lines up with the trend line to add to its strength as a ceiling and the line in the sand for a selloff around $63 per barrel. A break above this area could hint that a reversal from the drop is underway.
RSI has some room to climb to show that buyers could stay in control. However, stochastic is already turning lower from the overbought zone to show that sellers are taking over while buyers take a break.
In that case, the 50% Fib at $61.40 per barrel or the 61.8% level at $62.25 per barrel might draw sellers in. Crude oil could retreat to the swing low at $57.82 per barrel if that happens.
The upcoming inventory numbers from the American Petroleum Institute and Energy Information Administration might determine where crude oil is headed next. A large build could hint that demand is feeble due to the fresh lockdown measures announced in Europe while a draw could assure investors that purchases are supported.
Also note that the OPEC+ pledged to extend their output deal in order to keep a supply glut in check, so this could mean that a draw is possible.
Risk appetite appears to be shaky as investors weigh the potential impact of another set of restrictions on account of the increase in cases from the mutated strain of the COVID-19 virus.