
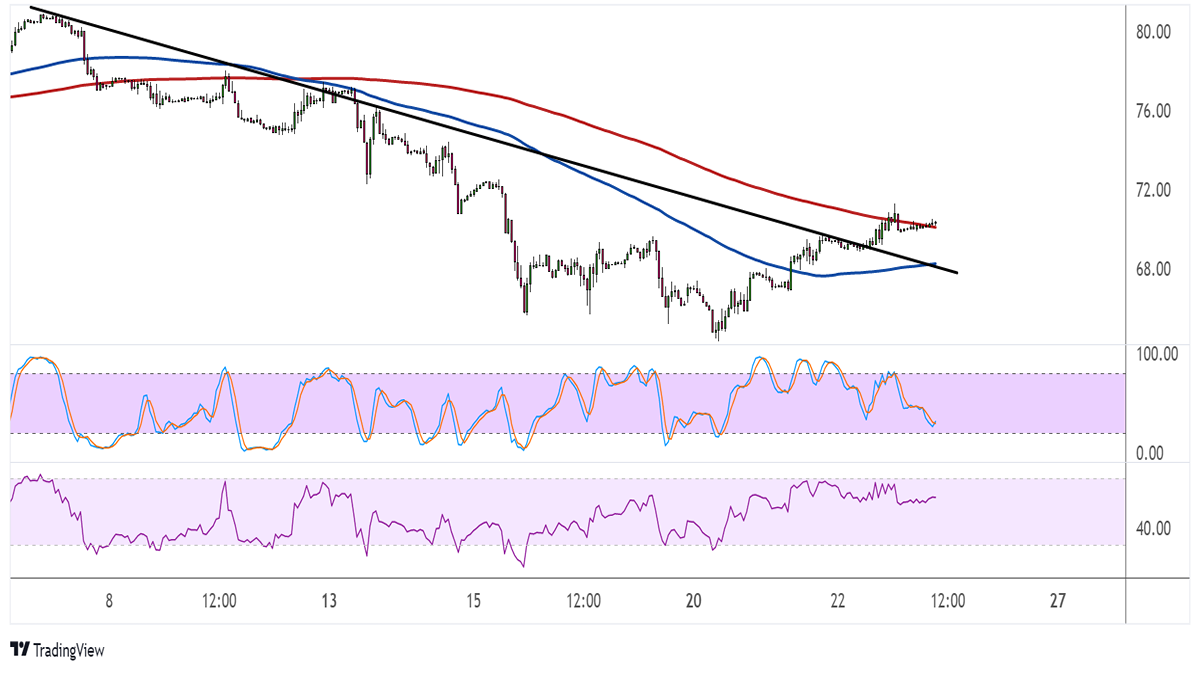
WTI crude oil closed above the descending trend line on its short-term time frame, as well as the neckline of a complex double bottom. Price might be due for a pullback, as it finds resistance around the 200 SMA dynamic inflection point.
On the subject of moving averages, the 100 SMA is below the 200 SMA to signal that the path of least resistance is to the downside or that the selloff is more likely to resume than to reverse. Then again, the gap between the indicators is narrowing to reflect slowing selling pressure and a potential bullish crossover.

Stochastic has room to head lower before reaching the oversold region to signal exhaustion among sellers. This means that the pullback could go on until the oscillator starts turning higher again.
RSI has more room to head south before indicating oversold conditions, so the selloff could last longer. A move back below the trend line could drag crude oil back down to the lows at $66 per barrel.
The Energy Information Administration reported a surprise build of 1.1 million barrels in stockpiles versus the estimated reduction of 1.7 million barrels, suggesting that demand has slowed.
However, crude oil was able to sustain its climb when the FOMC opted to hike rates by just 0.25% instead of the previously anticipated 0.50% increase. Fed head Powell also suggested that they could be approaching the peak of their tightening cycle soon but reiterated that they will continue to fight off strong inflationary pressures.
Still, the less hawkish statement was enough to boost risk-taking for commodities, as the lower probability of higher borrowing costs would mean more support for businesses and consumers down the line. If this kind of outlook persists, crude oil might be able to hold on to its gains and go for more.