
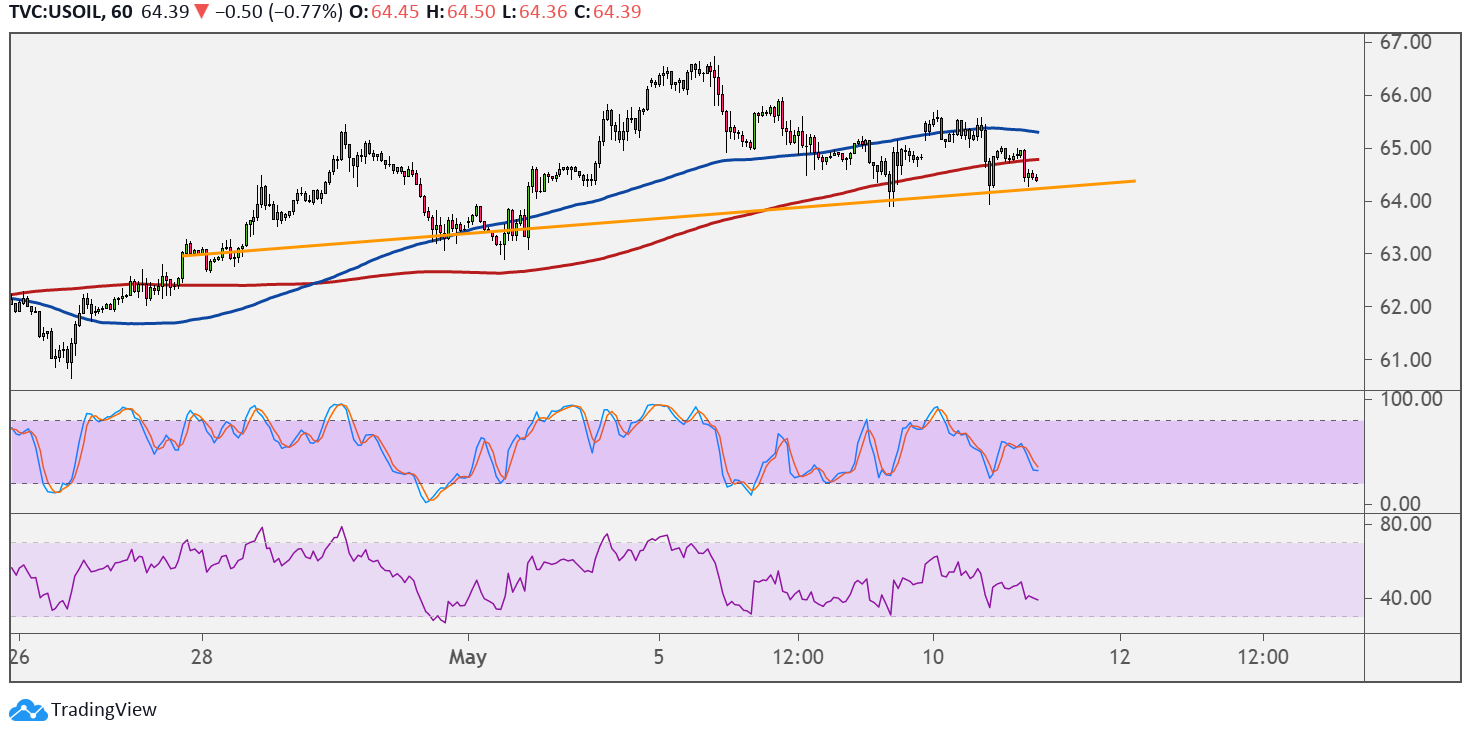
WTI crude oil might be in for a reversal from its rally, as price is forming a head and shoulders pattern on the 1-hour chart. Price is testing the neckline support, and a break below this could confirm that sellers are taking over.
The 100 SMA is still above the 200 SMA for now to suggest that support is more likely to hold than to break, but the gap between the indicators is narrowing to reflect weakening bullish pressure. Price is also below both moving averages, so these could hold as dynamic resistance.

Stochastic is pointing down to confirm the presence of bearish pressure, and the oscillator has room to go before reflecting oversold conditions or exhaustion among sellers. RSI also seems to be heading south, so crude oil prices could follow suit.
The chart pattern spans around $64 per barrel to $66 per barrel, so the resulting drop could be around $2 down to $62 per barrel.
Crude oil appears to be taking a hit from the pipeline cyberattack, although any major dips in supply could spur upside pressure on prices. The upcoming inventory reports from the API and the EIA would likely bring volatility for the commodity in the coming days.
A large draw in stockpiles could reflect a pickup in demand as more economies have reopened in the past weeks while a surprise build could bring losses for the commodity. On the other hand, a build in inventories would suggest that businesses are still being cautious, likely leading to losses for crude oil.
Also note that the latest US NFP reading turned out to be a huge disappointment, and this drop in hiring could be reflected in weaker price pressures or consumer spending from the CPI and retail sales reports lined up this week. If that’s the case, crude oil could take more hits as these would likely weigh on investor optimism.