
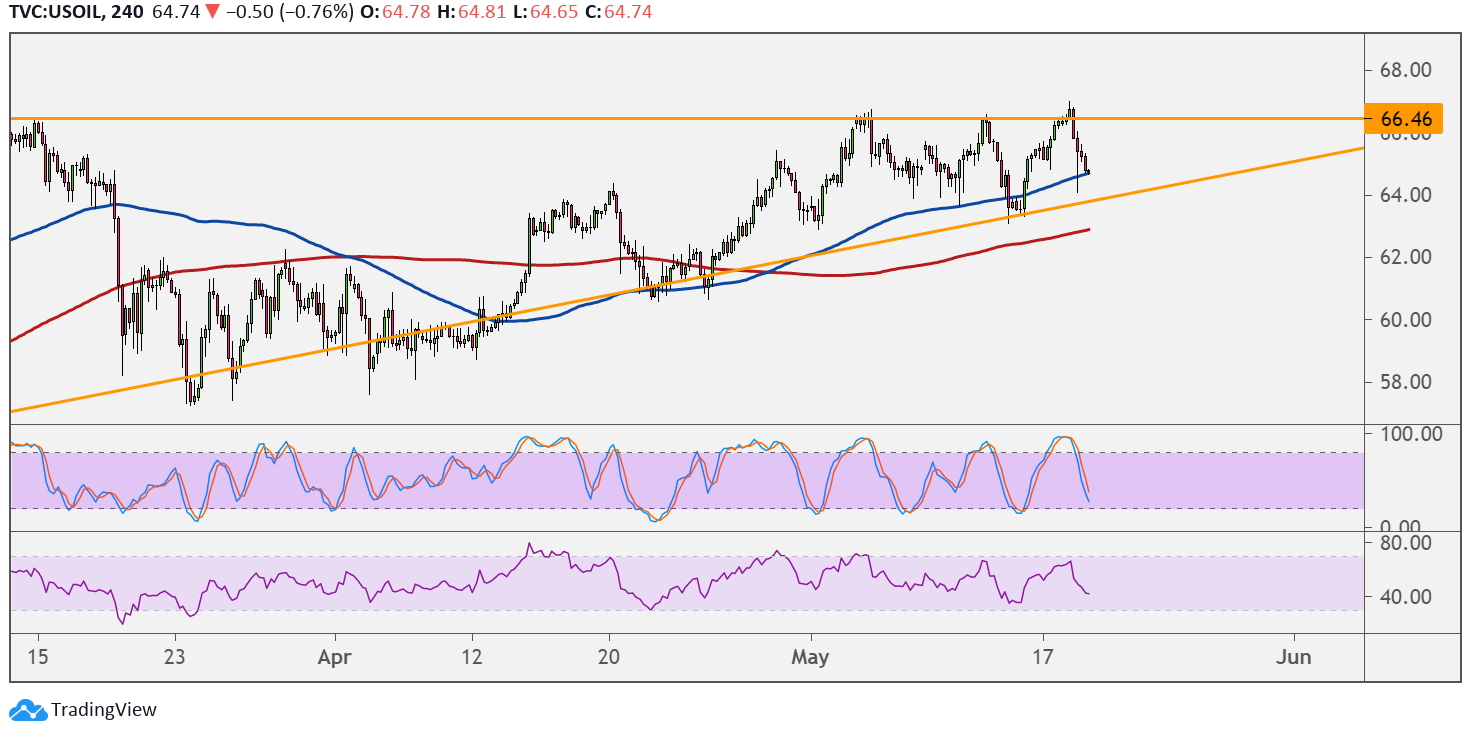
WTI crude oil is still consolidating inside its ascending triangle on the 4-hour time frame and is closing in on the bottom. A bounce from the $65 per barrel area could take it back to the triangle resistance.
The 100 SMA is above the 200 SMA to indicate that the path of least resistance is to the upside or that support is more likely to hold than to break. The 100 SMA is also holding as dynamic support at the moment.

A larger dip could find more buyers at the 200 SMA dynamic support, which is slightly below the triangle bottom. A drop below this could set off a slide that’s at least the same size as the chart formation, which spans $58 to $66.50 per barrel.
Stochastic has room to head lower before reflecting oversold conditions or exhaustion among sellers. Turning higher would confirm that buyers are taking over and the triangle support is likely to hold.
Strong bullish pressure might even spur a break past the triangle top and a climb that’s the same height as the triangle pattern. RSI also has some room to move south, so price could keep following suit until oversold conditions are met.
Crude oil could take cues from the inventory reports of the American Petroleum Institute and Energy Information Administration. A draw in stockpiles would confirm that demand is picking up on account of the reopening of several economies, which has boosted business purchases of fuel and energy commodities.
A build, on the other hand, could suggest that oversupply remains a concern. Recall that the OPEC agreed to increase output now that prices have stabilized above $60 per barrel, so a global glut could be possible.
Keep in mind that the rise in COVID-19 cases and fatalities in India might keep businesses wary of another wave of lockdown measures.