
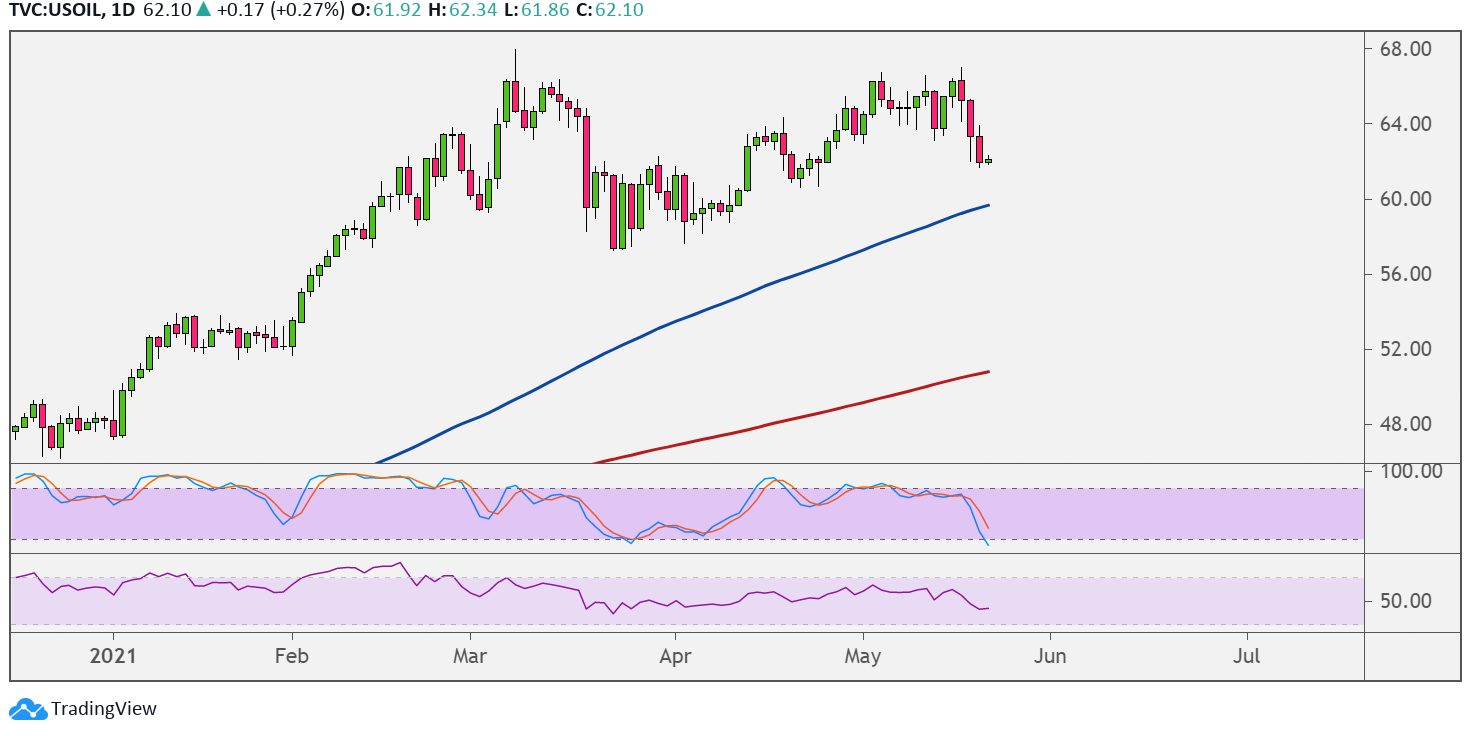
WTI crude oil could be in for a long-term reversal as a double top is forming on the daily time frame. A break below support at the $60 per barrel mark could set off a drop that’s at least the same height as the chart pattern.
However, the 100 SMA is still safely above the 200 SMA to indicate that the path of least resistance is to the upside. In other words, the climb might still resume on bounces off major inflection points. The 100 SMA dynamic inflection point is at the $60 per barrel level as well, so buyers might be waiting at this area.

Also, the gap between the indicators is widening to reflect strengthening bullish momentum. Stochastic is heading south, though, so crude oil price could follow suit until oversold conditions are met. RSI is also heading lower to reflect selling pressure.
The EIA reported a smaller than expected build of 1.3 million barrels in stockpiles versus the projected increase of 1.5 million barrels, although this follows a previous 0.4 million barrel reduction.
This suggests that demand may have slowed, even as more economies have reopened. Purchases could still pick up in the coming weeks, though, as more businesses might have increased demand for fuel and energy commodities.
Still, geopolitical risks in the Middle East and the surge in COVID-19 cases in India could keep a lid on risk-taking and investor optimism. After all, another wave of global lockdown restrictions could limit demand for crude oil.
At the same time, the Fed’s inclination to taper asset purchases as revealed in the FOMC minutes could weigh on business investment as higher borrowing costs could follow soon. Recall that inflation in April came in stronger than expected, prompting policymakers to shift their policy bias.